This article was first sent to our newsletter subscribers. To receive our monthly reports on the 1st of each month, subscribe now for free.
Introduction: Dispatch Down
A major highlight in November was the launch (finally!) of the "second initiative" of the Scheduling and Dispatch Programme (SDP_02) for batteries which has already resulted in a new battery discharge record. Thanks to this update, we now have real-time battery data and can show batteries on Irish Grid Daily, completing our real-time view of the Irish grid. We go into details in the storage section below but, before we delve into all the stats from last month, we'd like to follow up on our promise from last month with a review of our dispatch down analysis.
As discussed in October's Irish Grid Monthly, we suspect there are issues with solar farms' availability data in SEMO's reports, i.e. they are often a bit too high. We use dispatch instructions and codes to identify whether a unit is being constrained or curtailed; when availability figures are too high, this causes our dispatch down estimates to be higher than reality. It's probably easiest to show you a side-by-side comparison between our estimates and EirGrid's data.
The table below shows data and calculations for solar farms in the Republic of Ireland during October 2025. All the "dodgy" numbers are in bold.
| Metric | Green Collective | EirGrid | Ratio (Green Collective over EirGrid) |
|---|---|---|---|
| Metered generation, GWh | 42 | 50 | 84% |
| Availability (scraped), GWh | 69 | 59 | 117% |
| Availability (calculated), GWh | 52 | 59 | 88% |
| Constraints, GWh | 1.0 | 2.3 | 43% |
| Curtailment, GWh | 8.3 | 6.5 | 128% |
| Total dispatch down, GWh | 9.3 | 8.8 | 106% |
| Constraints rate | 1.9% | 3.9% | 49% |
| Curtailment rate | 16.0% | 10.9% | 147% |
| Total dispatch down rate | 17.9% | 14.8% | 121% |
A few notes to help make sense of the table:
- We expect our metered generation figure to be lower than EirGrid's. Not all units are required to be included in the SEMO metered generation reports which serve as the source of our estimates, while EirGrid reports data are based on all units. The 84% ratio is almost exactly in line with our expectation of around 85%.
- Availability:
- Availability (scraped) is aggregated directly from SEMO's publications.
- Availability (calculated) = metered generation plus the dispatch down (constraints + curtailment) we were able to categorise.
- The first note also applies to the discrepancy in availability, particularly Availability (calculated); 88% is just slightly higher than our expectation.
The main issue here is the availability data from SEMO: 69GWh from ROI solar farms is way too high compared to EirGrid's 59GWh. This issue then has ripple effects on our dispatch down estimates, as demonstrated by total dispatch down rates: 17.9% from Green Collective vs. 14.8% from EirGrid.
A secondary issue is the classification of constraints and curtailment. As noted earlier, we use dispatch instructions and codes but we perhaps are not fully understanding how the different instructions stack against each other, which seems to result in an underestimation of constraints and an overestimation of curtailment.
While solar seems to have availability data issues, we are happy to see wind is in much better shape. We expect to see our metered generation and availability to be about 90% of EirGrid's data, so the 92%/91% alignment below is great (again, "dodgy" numbers are in bold).
| Metric | Green Collective | EirGrid | Ratio: Green Collective/EirGrid |
|---|---|---|---|
| Metered generation, GWh | 993 | 1,076 | 92% |
| Availability (scraped), GWh | 1,180 | 1,294 | 91% |
| Availability (calculated), GWh | 1,180 | 1,294 | 91% |
| Constraints, GWh | 117 | 147 | 80% |
| Curtailment, GWh | 70 | 60 | 117% |
| Total dispatch down, GWh | 187 | 207 | 90% |
| Constraints rate | 9.9% | 11.4% | 86% |
| Curtailment rate | 5.9% | 4.6% | 128% |
| Total dispatch down rate | 15.8% | 16.0% | 99% |
Better quality of availability data then leads to quite a close calibration of total wind dispatch down: 15.8% from Green Collective and 16.0% from EirGrid. Similar to solar, the classification of constraints vs. curtailment could use some improvement. However, we take solace in the facts that:
- the total dispatch down rate estimate is almost perfect
- we are able to correctly identify last month's main reason behind wind dispatch down is constraints, not curtailment
Maybe it's not wise to show our work in such detail when the solution is not quite up to our usual standards just yet. However, we hope it's worth it to highlight ongoing issues with solar availability data – and we're always looking for suggestions to improve. If you have some pointers for how to better classify constraints and curtailment, you know where to find us (hello@greencollective.io)!
Summary
Electricity demand across the island totalled 3726.5GWh during November 2025. This was the highest total for any November month and the 4th highest-ever monthly total. Generation totalled 3152.7GWh, the lowest for any November month. Net imports totalled 573.8GWh, equivalent to 15.4% of electricity demand. This was the highest amount of imports yet for a November month.
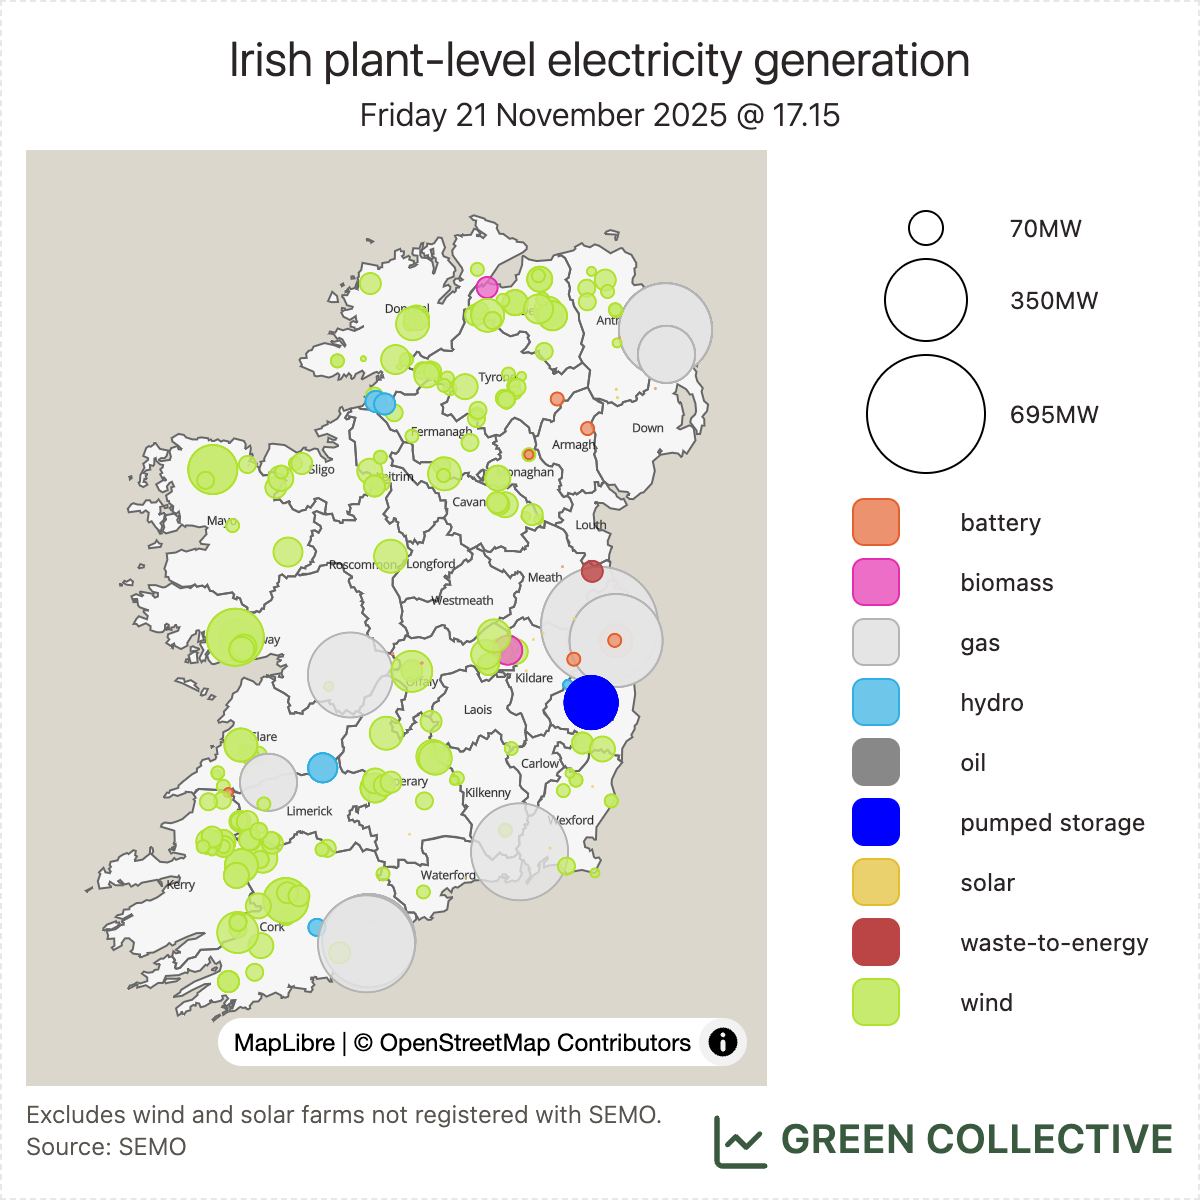
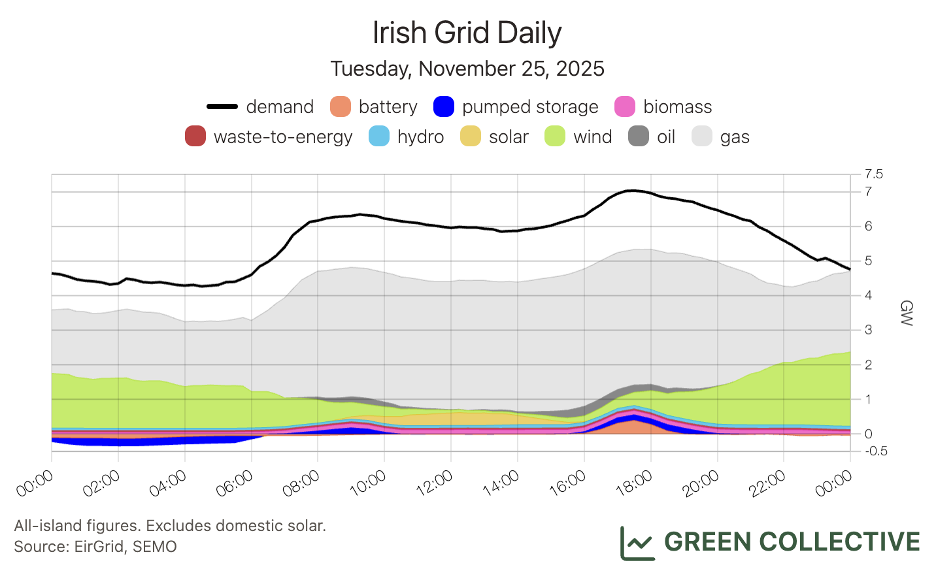
Although total generation was low, cold weather on November 21 helped spur a new all-time output high across the island: 7774MW, beating the previous record of 7712MW set in February. Below is a map of all large-scale generation at that moment; as the size and number of the grey circles suggests, winds were only medium-strong at the time.
Renewable generation totalled 1479.8GWh for the month. This was the second-highest amount for renewable sources in a November month, behind only November 2022's exceptional 1743.9GWh. This was equivalent to 39.7% of electricity demand, the fourth-highest share for renewables in a November month.
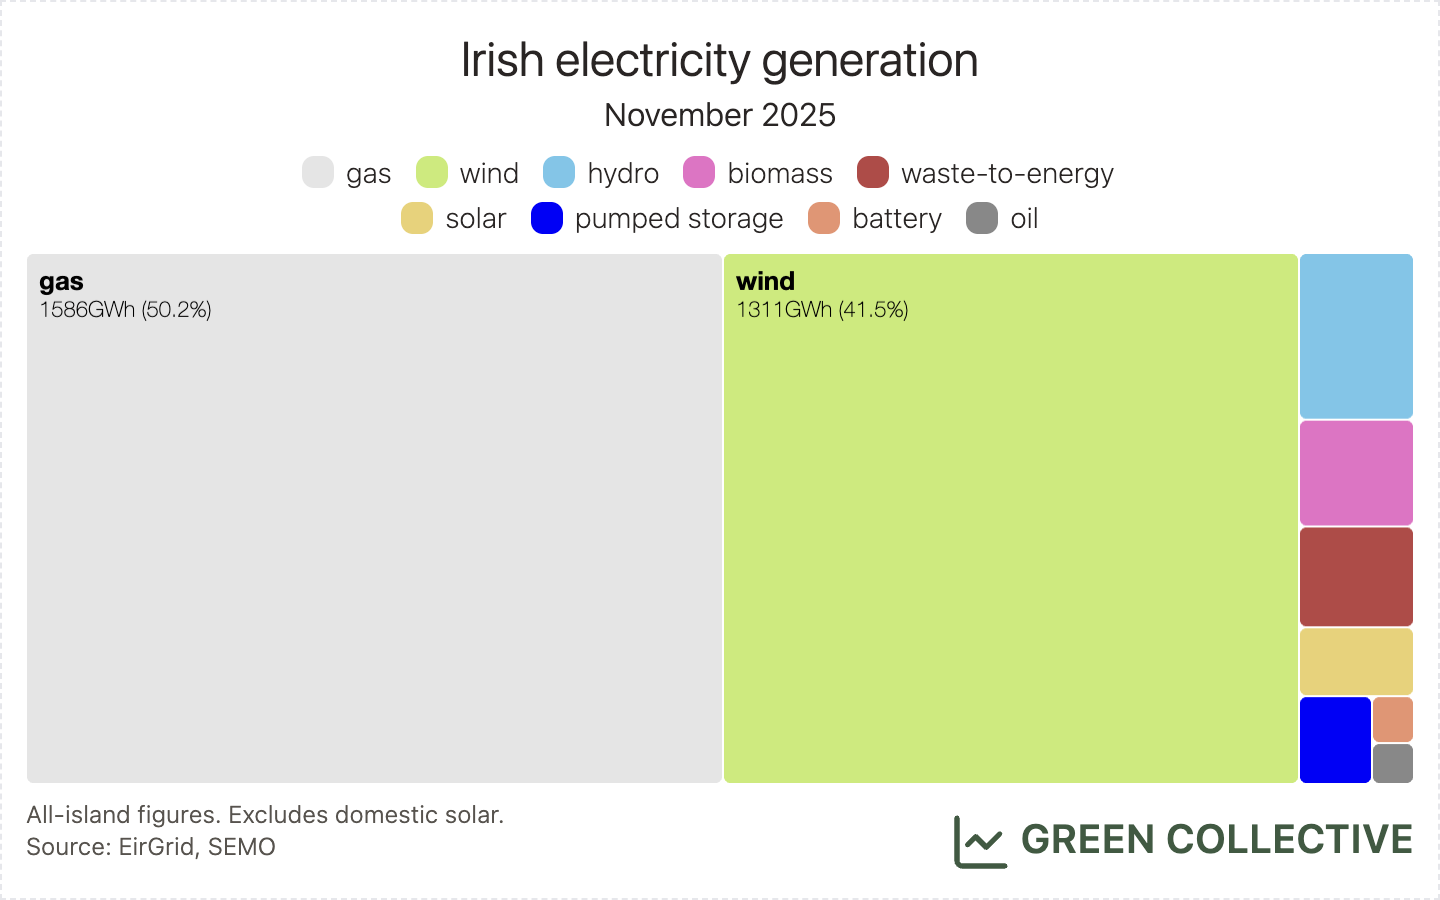
Fossil fuel generation totalled 1642.8GWh, equivalent to 44.1% of electricity demand. Both figures are all-time lows for fossil fuels in any November month for which we have data (that's November 2018 onwards).
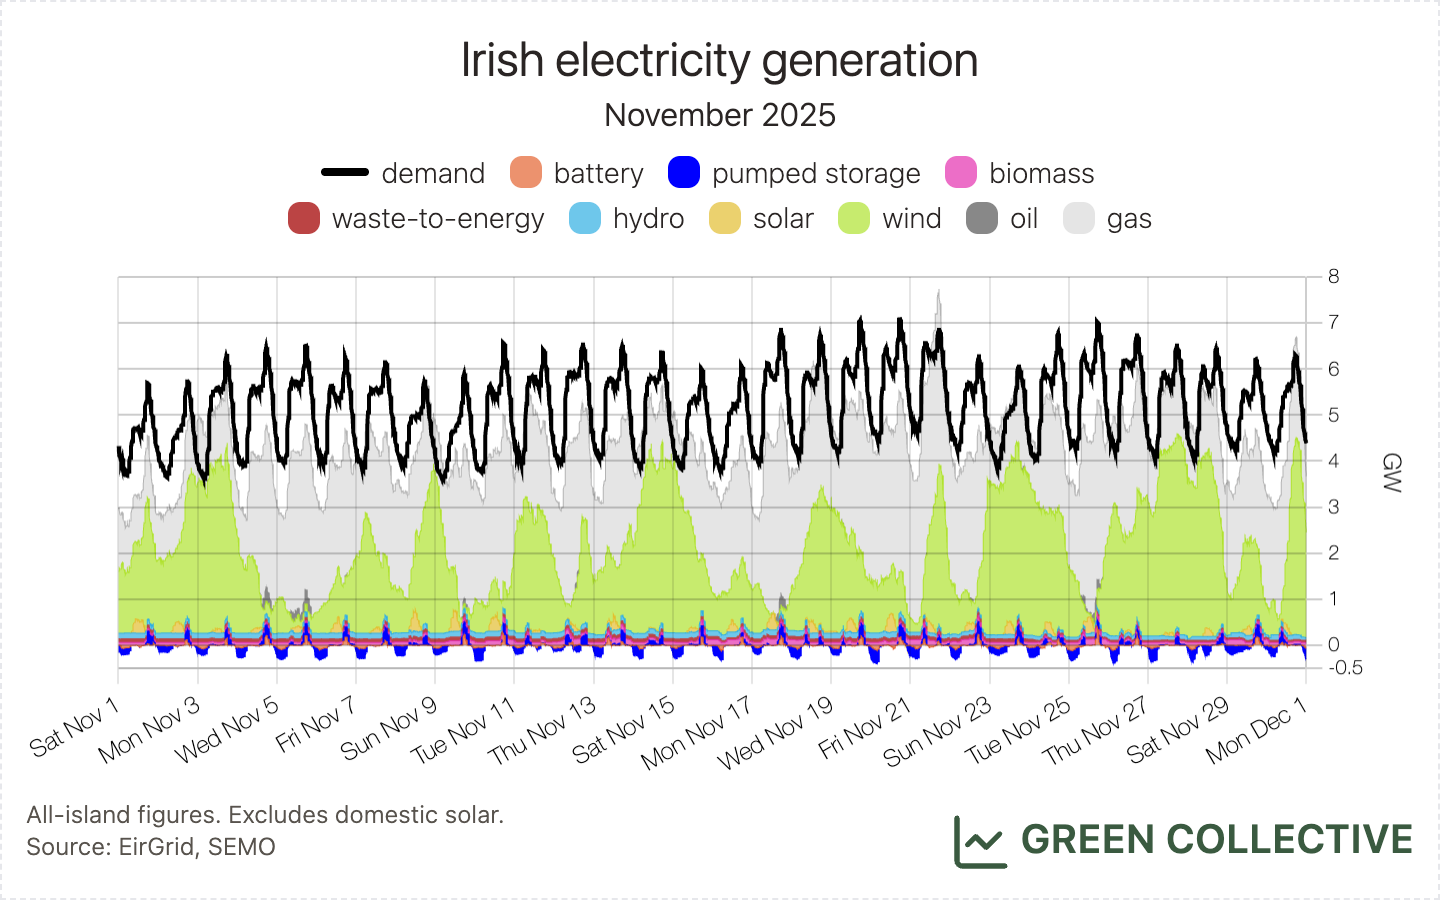
Here's a breakdown of how much electricity demand each source met:
- renewable generation:
- wind: 35.2%
- hydro: 2.2%
- solar: 0.9%
- biomass: 1.4%
- fossil fuels:
- gas: 42.6%
- oil: 0.2%
- waste-to-energy: 1.3%
- storage:
- pumped hydro: 0.7%
- batteries: 0.2%
Wind
1311.4GWh of wind generation was the second-highest highest amount for a November month, behind only November 2022's exceptional 1613.9GWh. This was equivalent to 35.2% of electricity demand, the fourth highest proportion for wind in a November month.
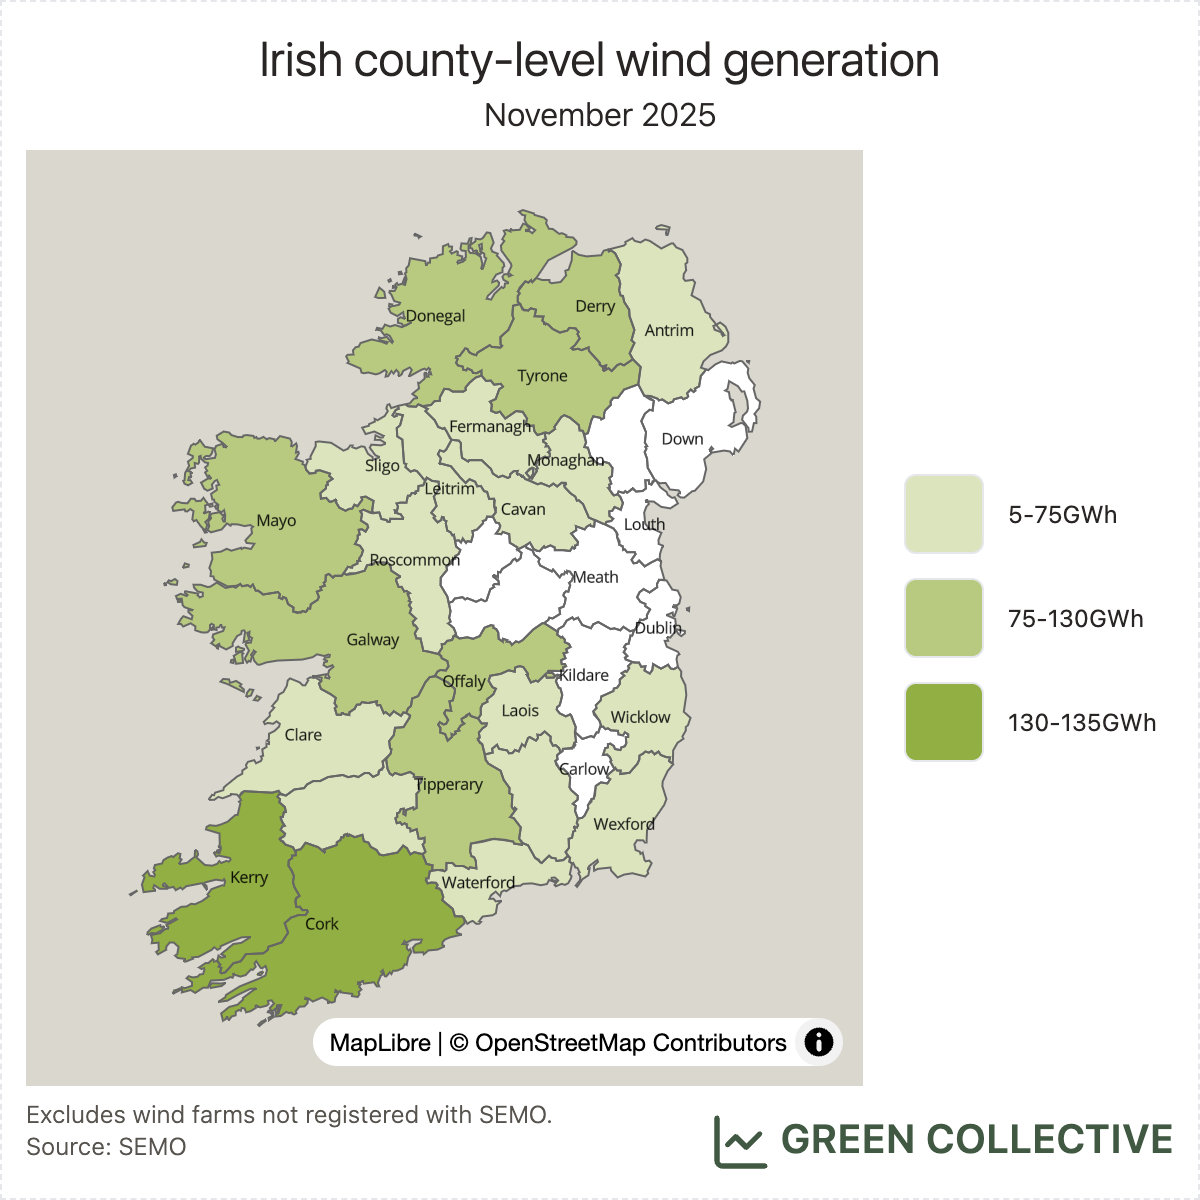
The top wind-producing counties during November 2025:
- Kerry (133.2GWh)
- Cork (132.3GWh)
- Offaly (100.6GWh)
- Galway (94.6GWh)
- Derry (93.3GWh)
As usual, Kerry and Cork take top spots for wind generation. This month, Offaly claims #3: Yellow River was back in continuous operation – albeit seemingly capped well below its maximum of 75MW at about 50MW – and the new Cushaling Wind Farm continued to operate at full tilt, having first started doing so during October. Galway and Derry are regulars here (Derry only since August 2025 but now a solid one) and regular readers will realise Mayo is absent: Oweninny, the island's largest wind farm, was operating at less than half capacity towards the end of the month. With Offaly and Derry having added significant capacity in recent months, any hiccup at Mayo's only large wind farm is more and more likely to knock Mayo out of the top #5.
Solar
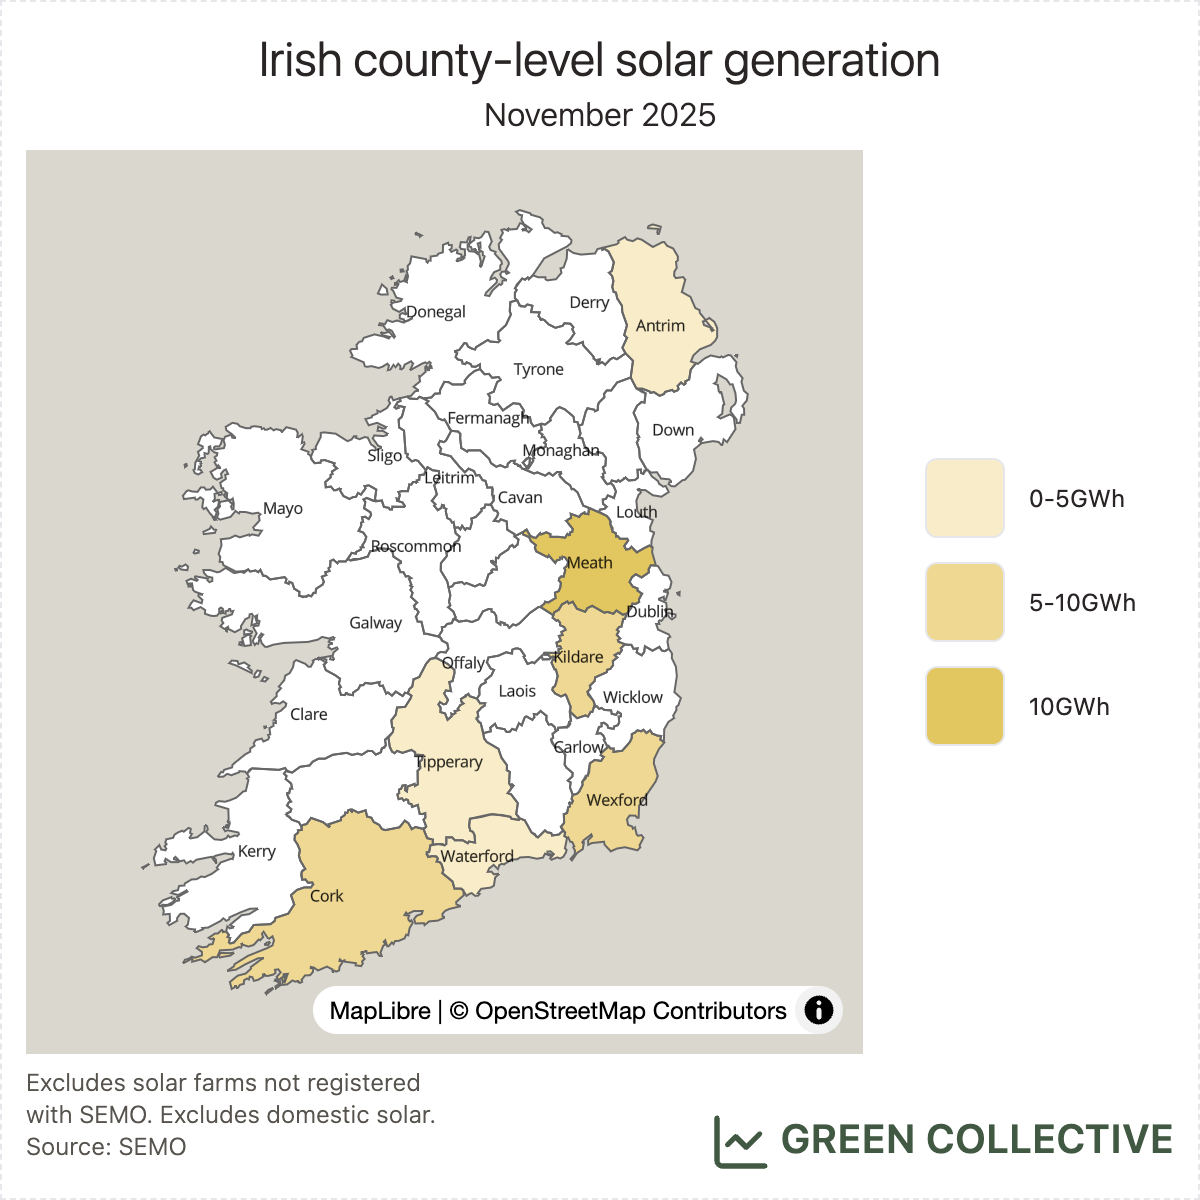
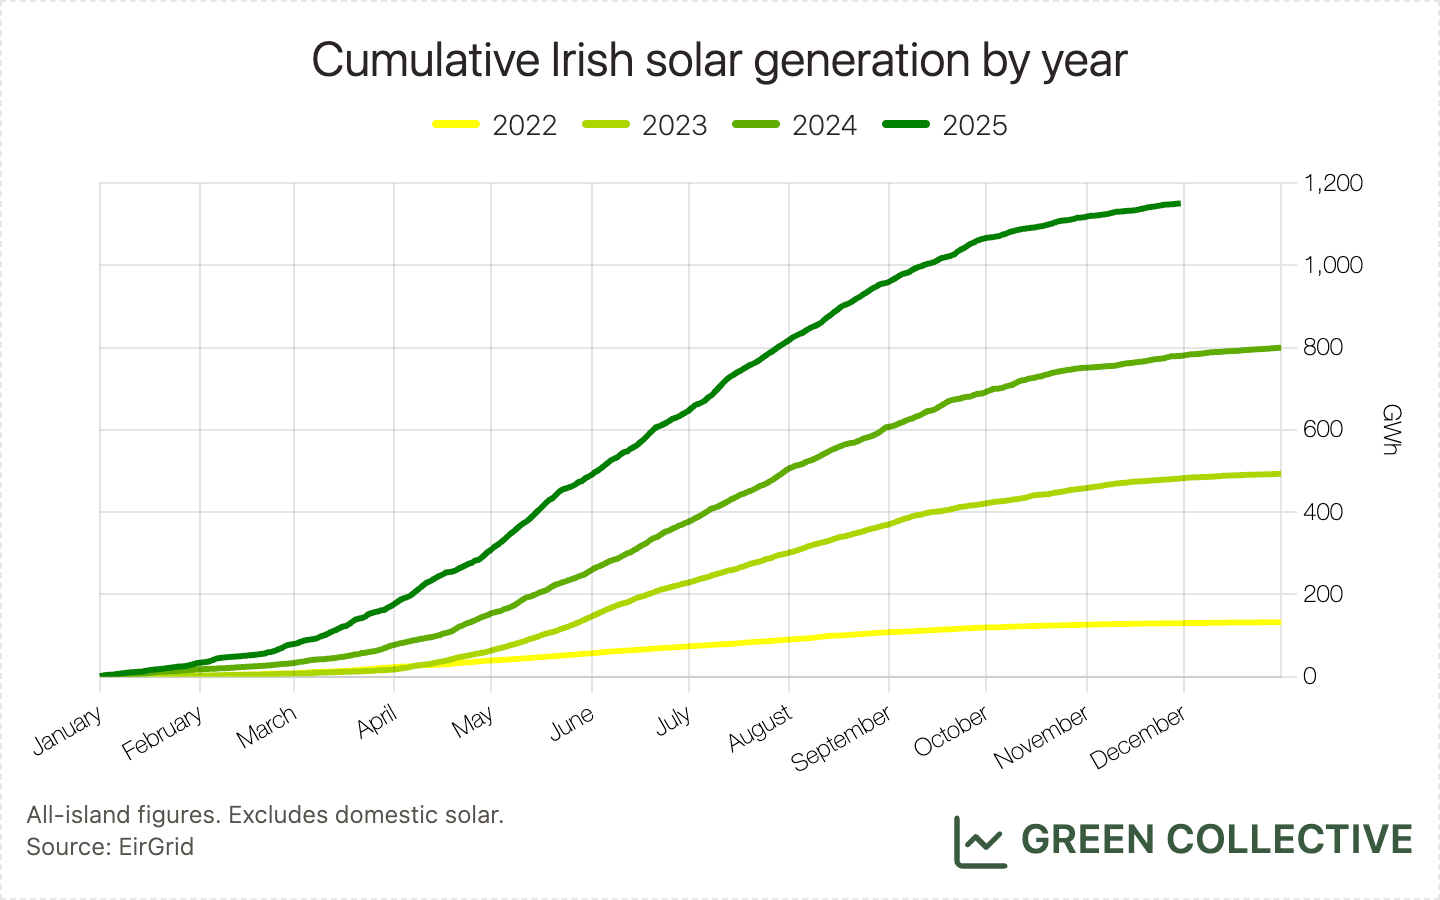
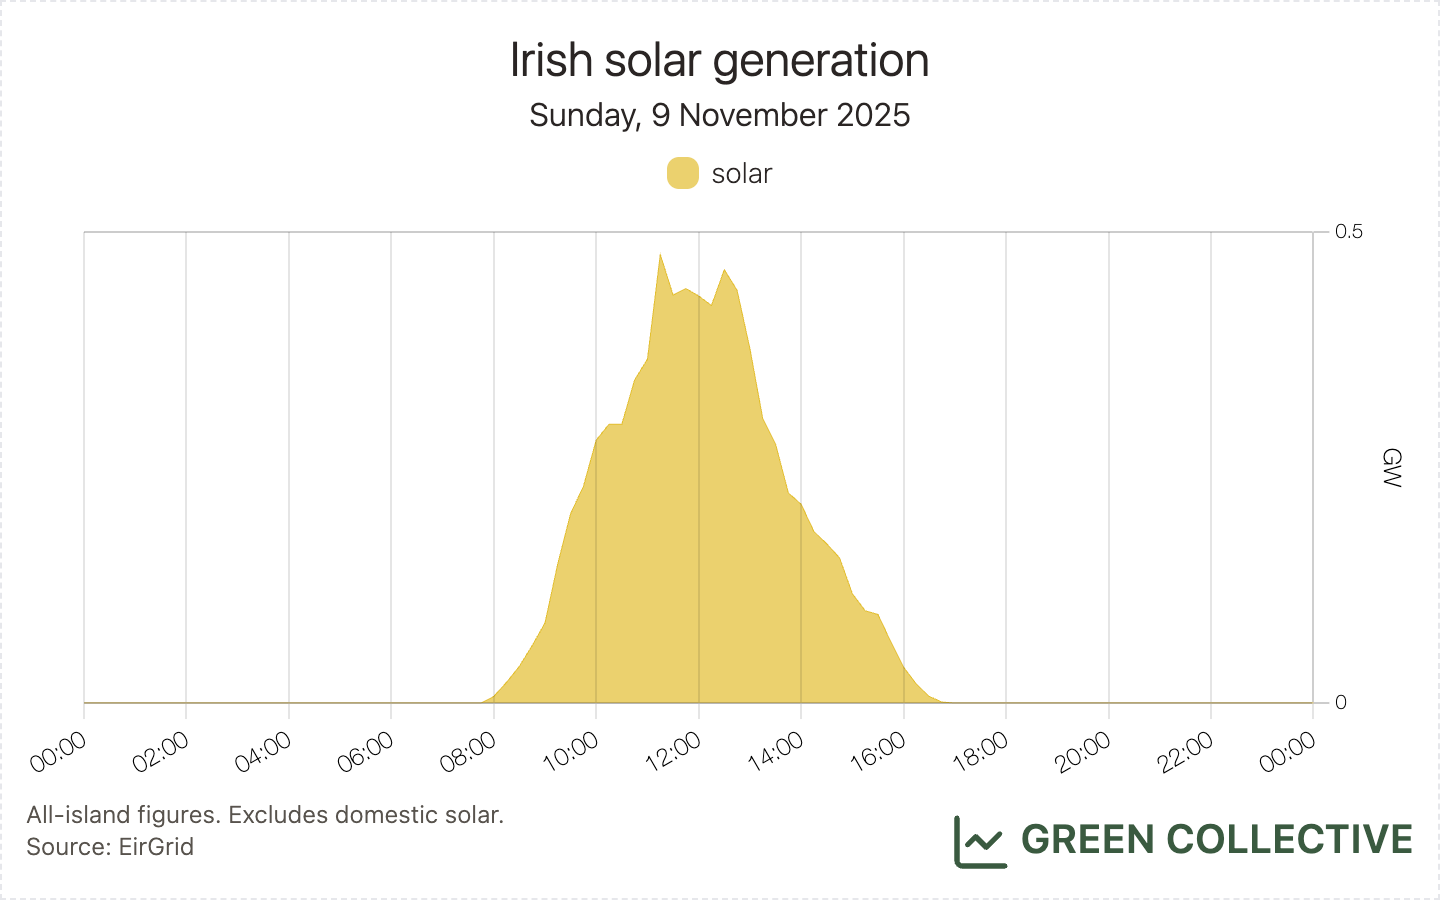
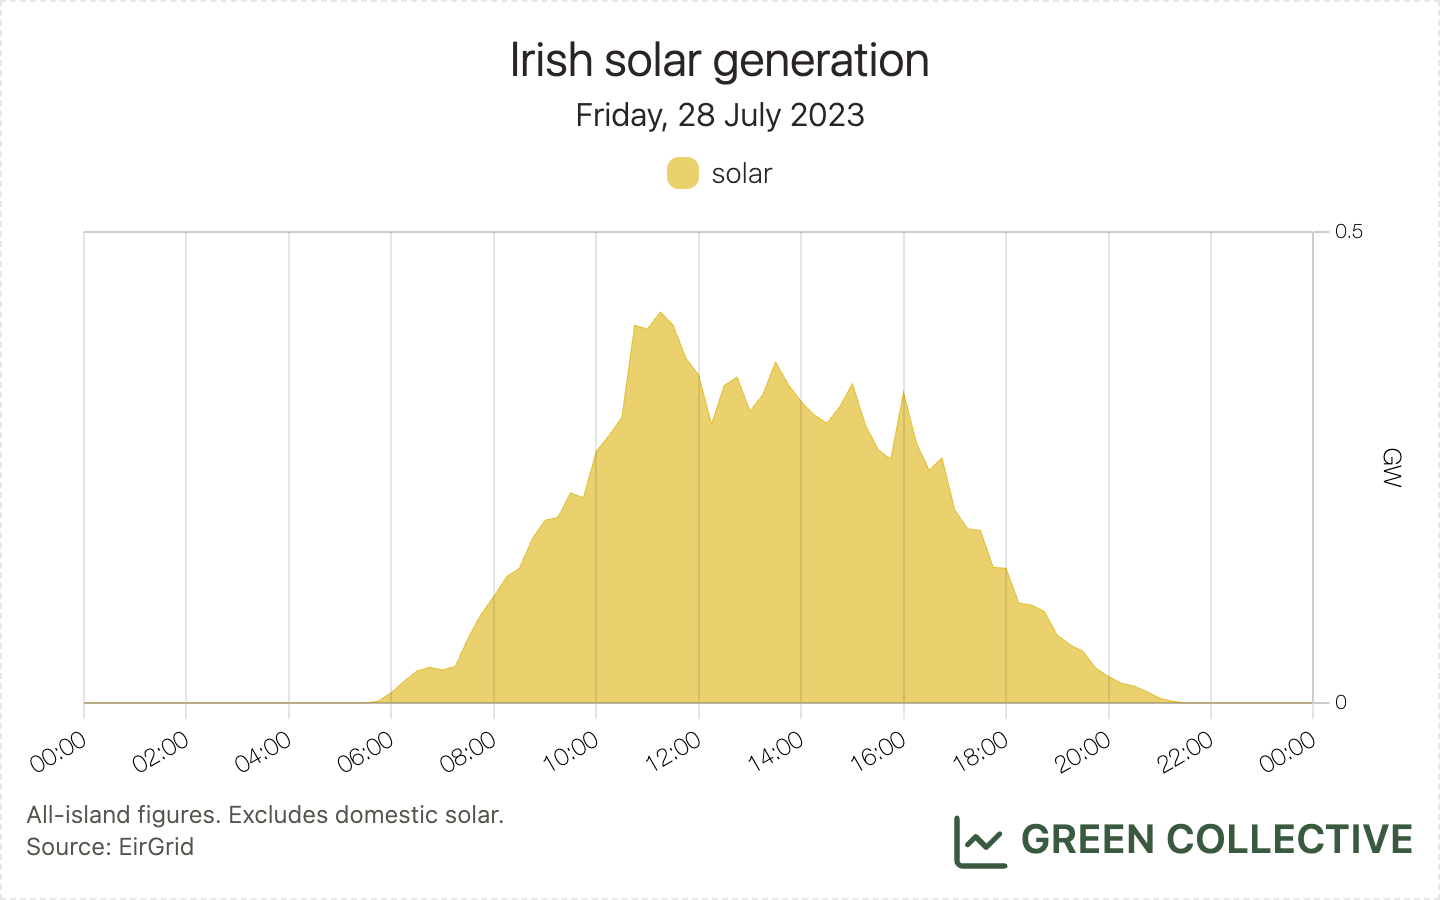
33.9GWh of solar generation was equivalent to 0.9% of electricity demand. Both figures are the highest yet for solar in a November month. This is a welcome return to form for solar after last month's unfortunate backwards step.
With peak outputs of 477MW (equivalent to approximately 10% of demand), we're now seeing on winter days the kinds of highs we excitedly reported on summer days as recently as 2023.
The top solar-producing counties during November 2025:
- Meath (9.7GWh)
- Wexford (5.1GWh)
- Cork (4GWh)
These top three counties each month have been virtually unchanged in 2025 with only the occasional appearance of Kildare at #3, ousting Cork. We're keeping an eye on Drombeg Solar in Kerry – the county's first large-scale solar farm – which appeared in SEMO's publications as far back as August but still hasn't exported to the grid.
Storage
8.3GWh of discharging battery was by far the highest yet for a November month, at approximately 3x that of November 2024's 2.6GWh, and in fact was the second-highest ever monthly total, behind only May 2025.
The Scheduling & Dispatch Programme (DSP_02) came into effect in mid-November. Previously, batteries could only submit positive physical notifications (PNs) for grid operators to dispatch batteries to discharge into the grid. This update enables batteries to submit negative PNs and now grid operators can dispatch batteries at negative levels for batteries to charge from the grid as well.
While batteries have been participating in wholesale trading for months if not longer, SDP_02 brings material changes in how batteries engage in energy arbitrage. A key feature of this update is to enable grid operators to follow the PNs batteries submit – positive and negative – so owners and operators of BESS assets can more reliably optimise revenues from wholesale markets.
High wholesale prices are the key incentive for batteries to participate in wholesale trading. On November 25, there was little wind and market conditions were tight due to high demand during a cold snap. Prices were high: day-ahead prices peaked at 466 euro/MWh entering evening peak hours and we saw record battery discharges that evening.
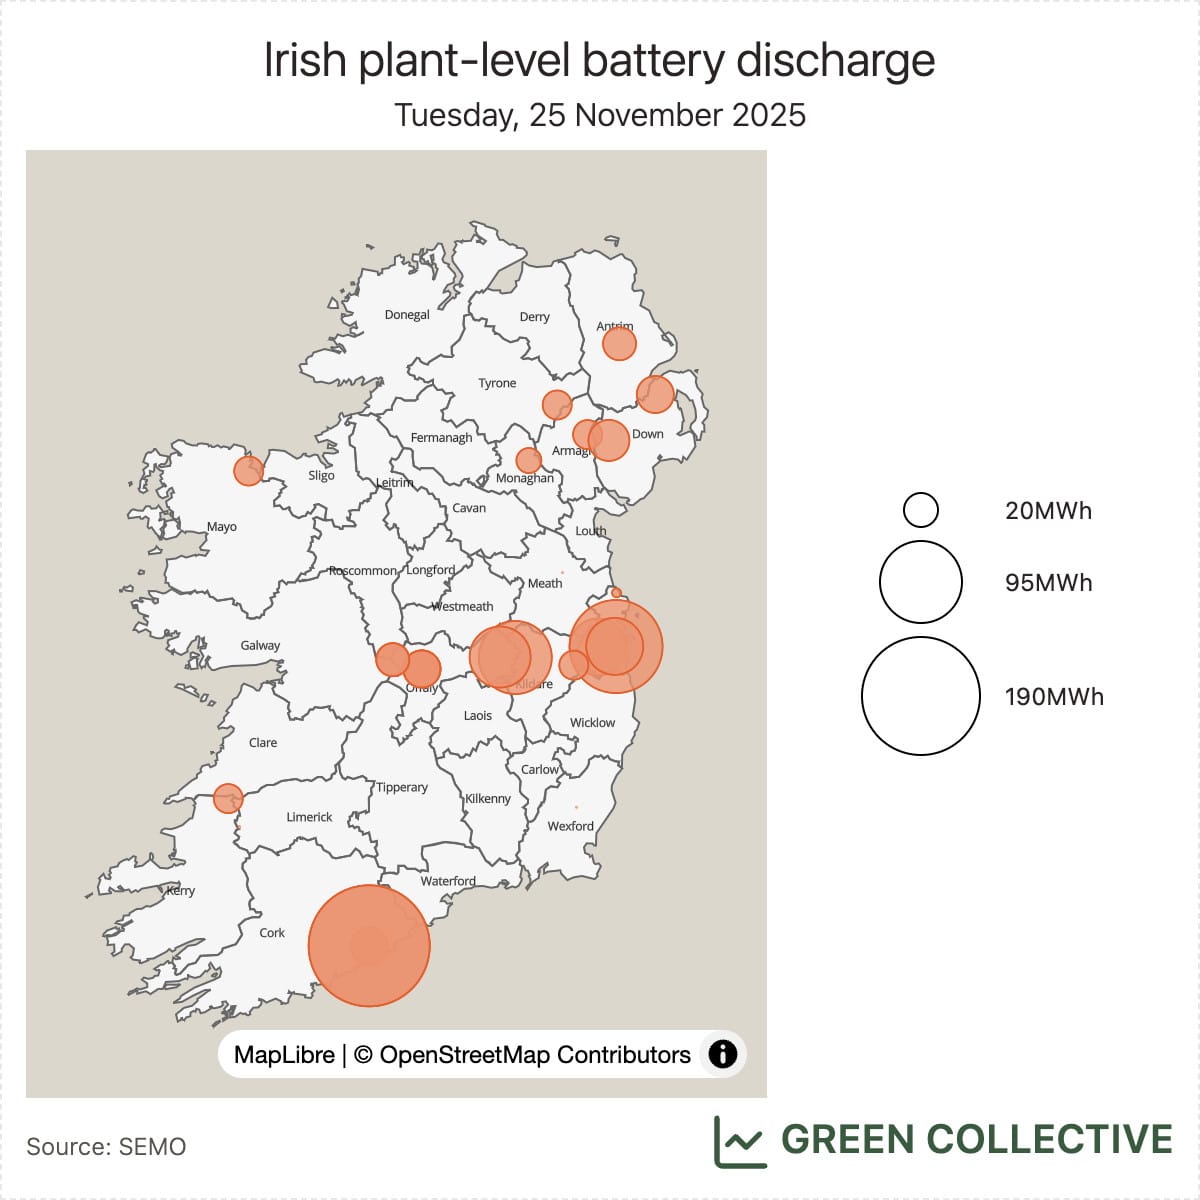
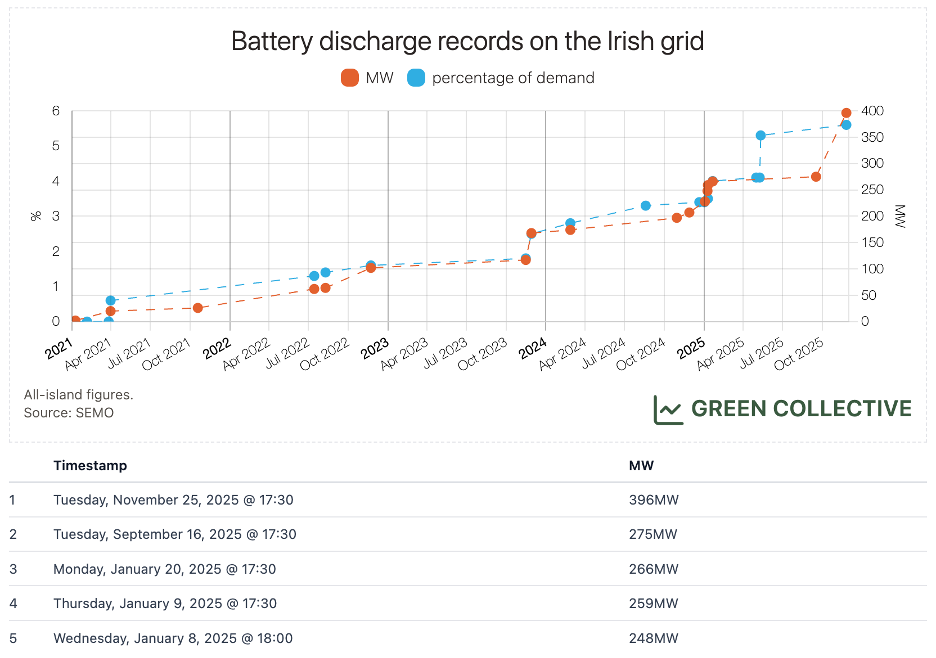
Based on metered generation data, battery discharge reached 396MW at 17:30 on November 25. The chart below shows the full history of battery records on the Irish grid. We saw a flurry of records last winter, shortly after revenue potential from the DS3 Programme (ancillary services) reduced for batteries, nudging more BESS to discharge during peak hours and earn revenues from energy arbitrage. On November 25, we saw more batteries participate in wholesale trading than ever. The jump from less than 300MW to around 400MW demonstrates the impact from the SDP_02 update already. As always, you can follow Irish grid records in real-time just like we do via our records dashboard.
While a new record is exciting, it's also important to keep track of whether grid operators are actually fully implementing the SDP_02 update, i.e. whether grid operators are always following the PNs submitted by battery operators. Based on what we've gathered so far, the answer is...not all the time? Taking November 25 as an example again, we compared dispatch levels and PNs for both charging and discharging. The chart below shows the comparison and we added day-ahead prices for reference as well.

When we look at discharges, what batteries submitted as PNs and what grid operators dispatched align for the most part. Unsurprisingly, batteries requested to be discharged during evening peak hours with the highest wholesale prices. However, when we look at charging amounts, the alignment looks worse. This could be due to an operational constraint currently in place: batteries cannot charge more than 5MW or 20% of maximum export capacity (whichever is greater) at a time. Some batteries submitted negative PNs beyond this operational constraint. Grid operators couldn't follow those PNs and charging had to be spread out further.
We will provide more details in the next Benchmarking Batteries newsletter issue. In the meantime, please let us know if you have any questions about SDP_02!
Carbon Emissions
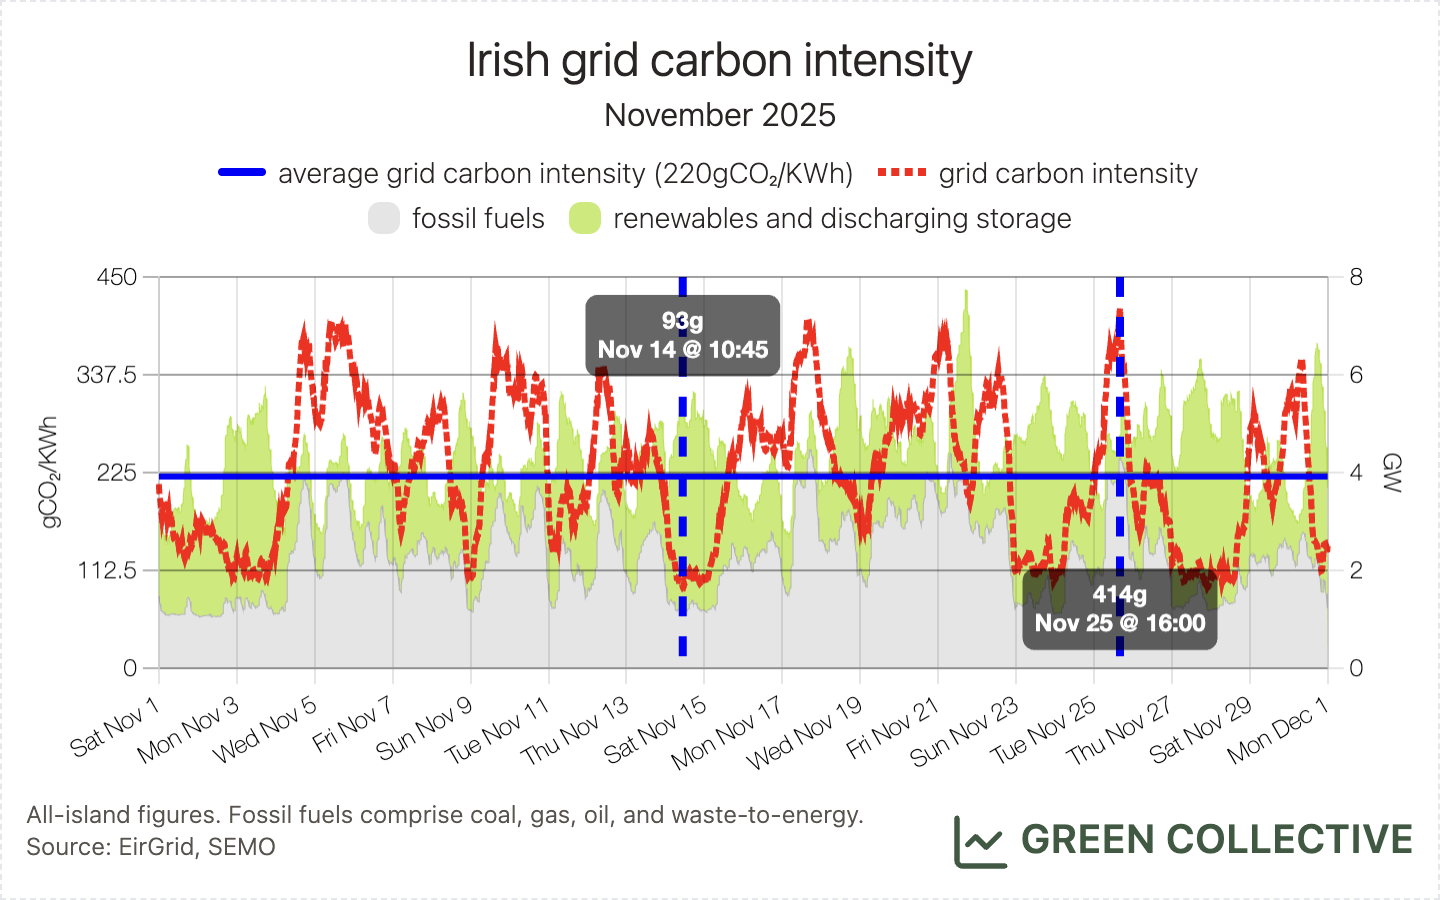
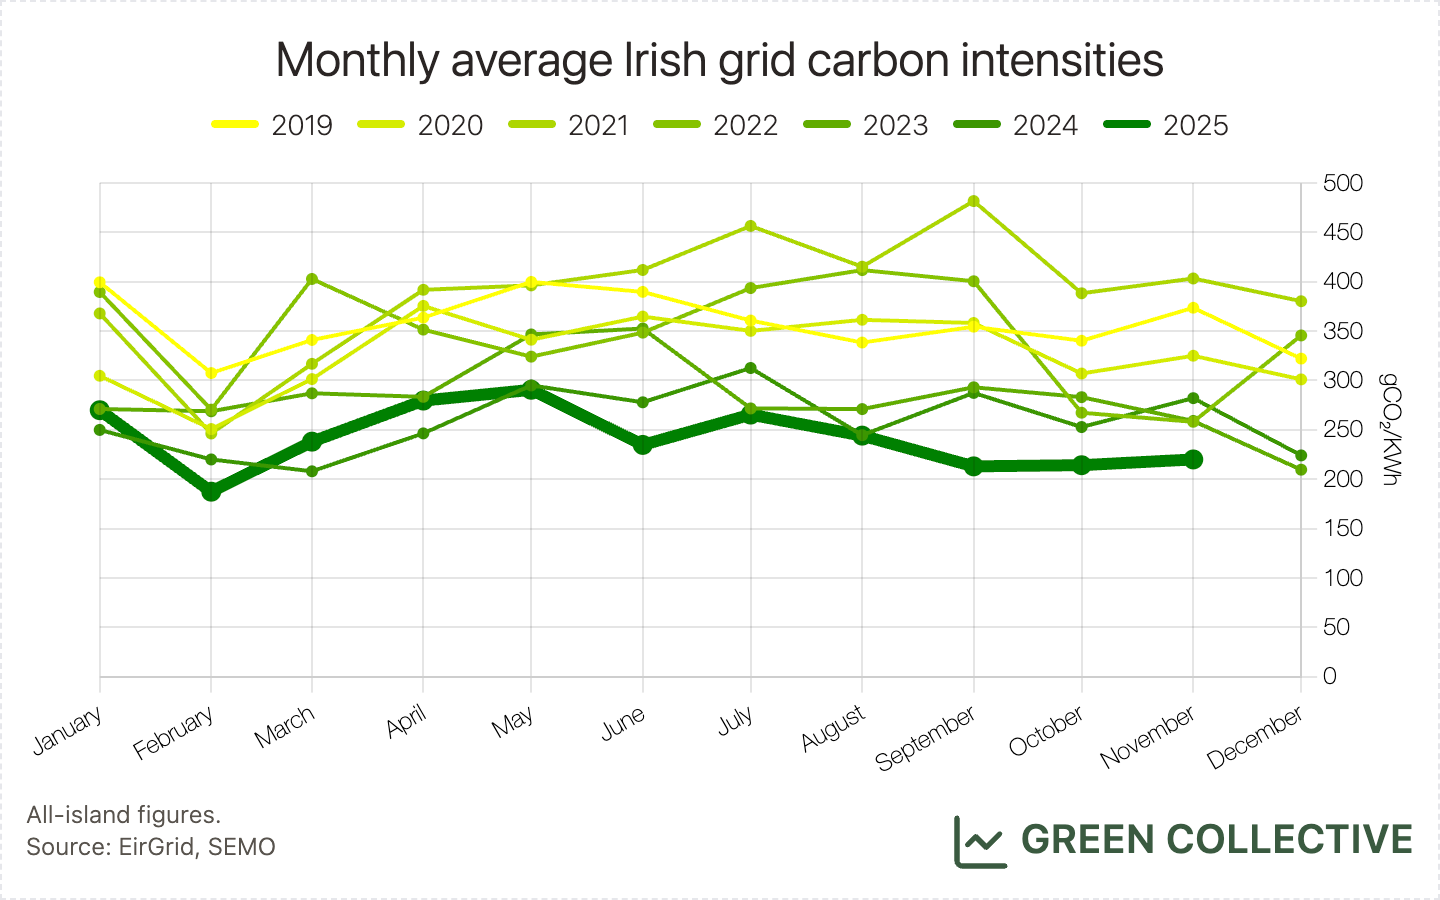
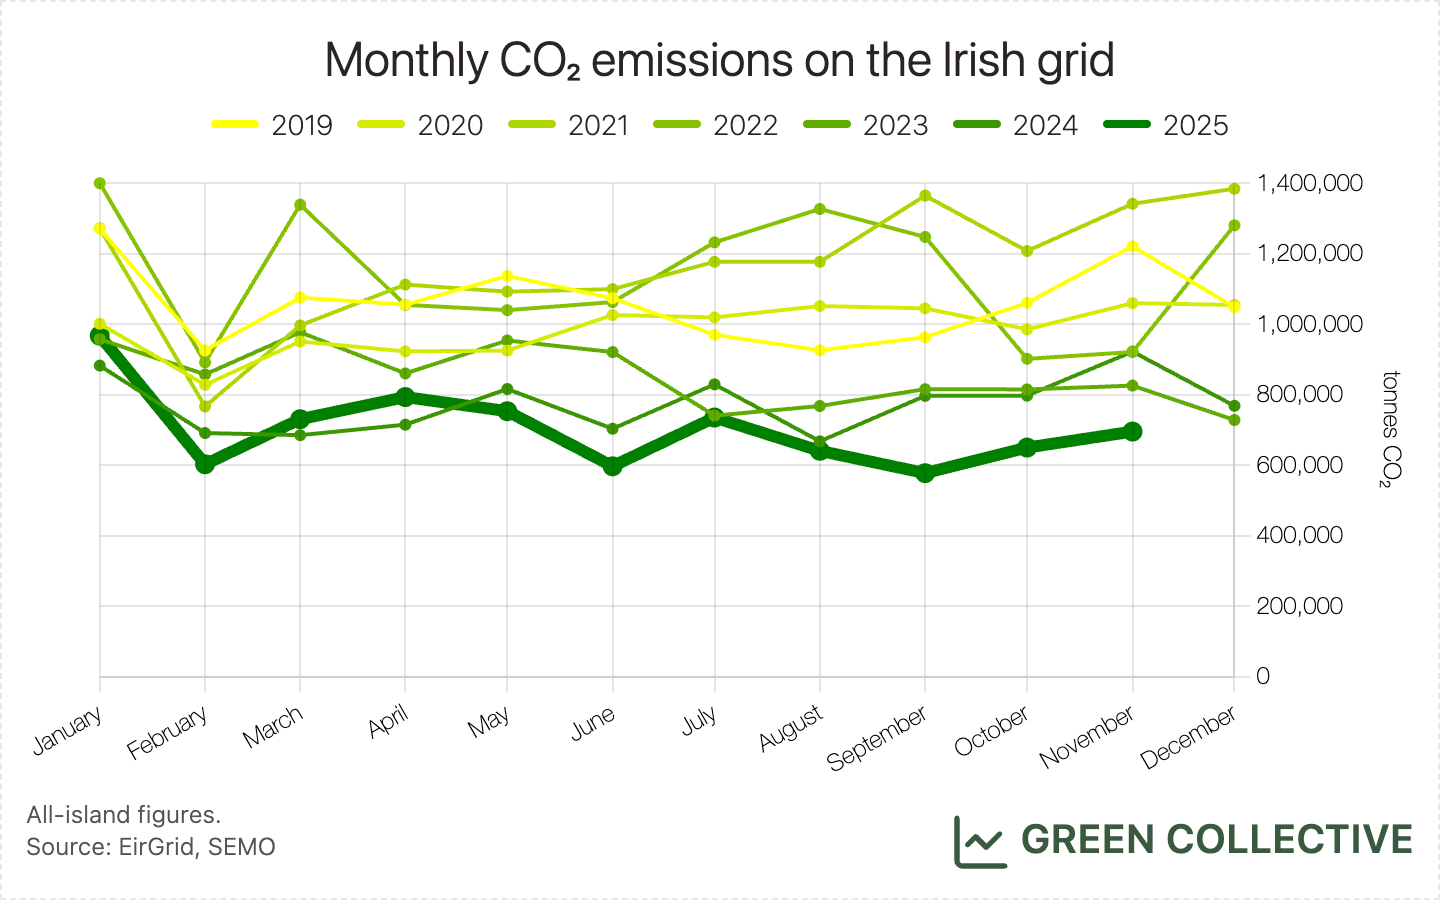
We estimate that during November 2025 the Irish grid emitted approximately 695,000 tonnes of CO₂, emitting between 93g and 414g of CO₂ for each kWh of electricity generated for an average grid carbon intensity of 220gCO₂/KWh.
This was the lowest GCI for a November month by some distance, beating 2022's 258gCO₂/KWh. It was also the lowest amount of carbon yet emitted by the Irish grid in a November month, beating November 2023's 825,000 tonnes.
This is the fourth month in a row to claim both records: an unprecedented streak on the Irish grid. As we've repeatedly stated here in our newsletter, imports, more than increased domestic renewable generation, are the chief enabler here, accelerated by the opening of the Greenlink interconnector earlier this year. While those imports from the GB grid aren't carbon-free, they are generally cleaner than the Irish grid. To give some idea of how much Greenlink has changed things in 2025, all of the top 10 days for imports in a November month occurred in November 2025.
Regarding fuel mix, we're happy to report that oil generation was the lowest we've yet seen during a November month: just 7.3GWh, about 1/3 of November 2024. Additionally, November 2025 saw some of the lowest fossil fuel generation for any November days, bottoming out at just under 28GWh on both November 1 and 2.
Hatches & Dispatches
New solar farm
Clonin North Solar Farm, located in Offaly, has appeared in SEMO's registered unit list on November 22. This will be Offaly's first large-scale solar farm.
Offshore wind auction
On November 26, the Department of Climate, Energy and Environment (DCEE) provisionally awarded the Ørsted and ESB joint venture the rights to develop the Tonn Nua site, off the coast of Waterford.
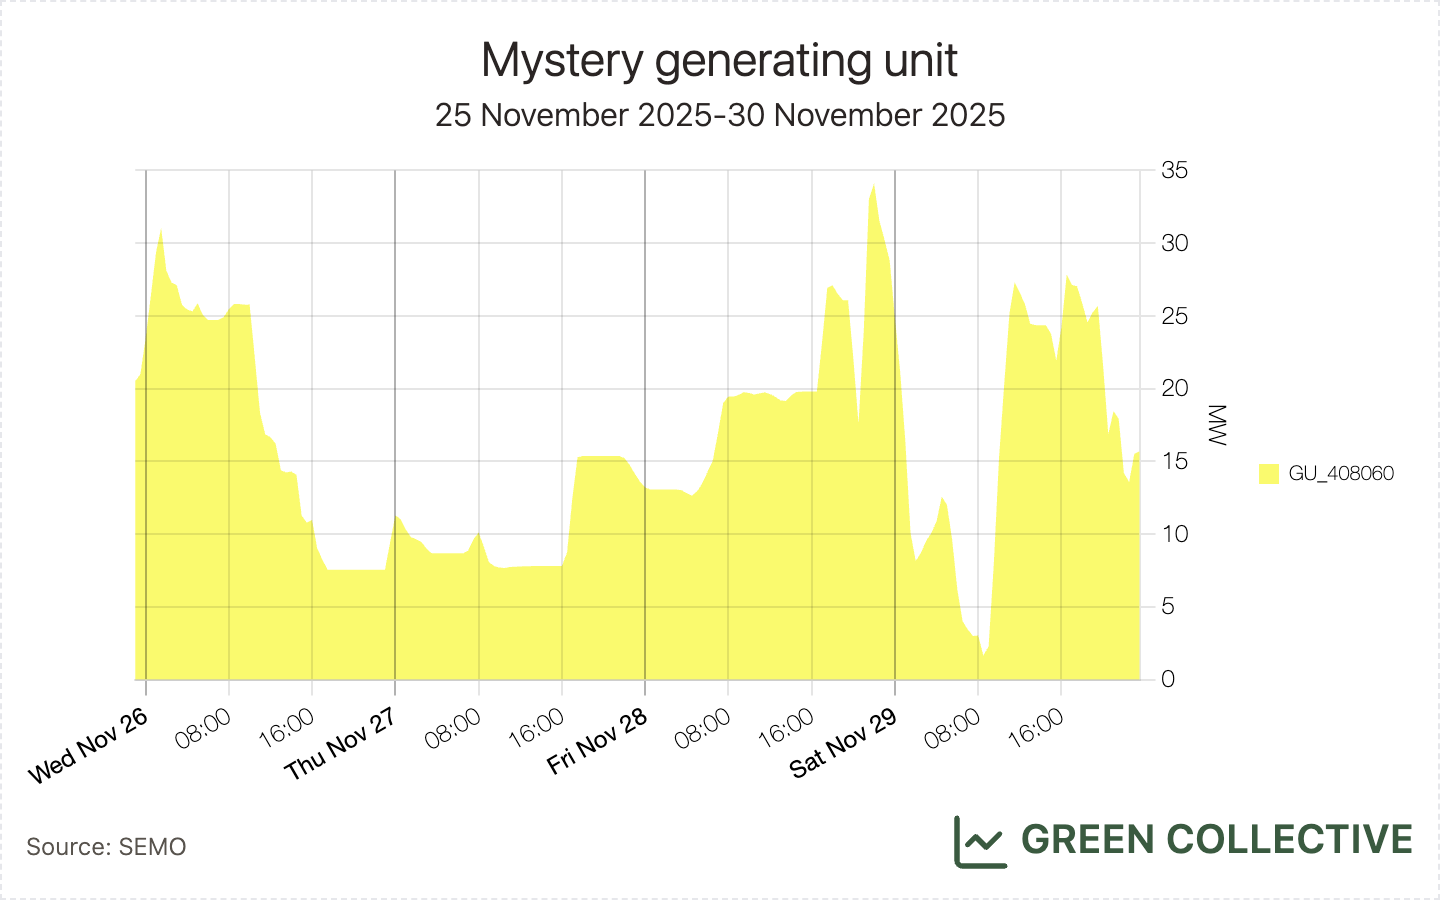
Mystery power plant
A new, mystery unit appeared in SEMO's metered generation on November 25. This isn't unusual and isn't usually a concern because units typically arrive in the database several days if not weeks (or, in the case of Drombeg Solar, months) ahead of their first export to the grid but this one went right to 30+MW before SEMO had a chance to update their index.
To give you an idea of the kind of detective work we often find ourselves at:
- it's clearly not a solar unit, which have very clear peaks each day around noon
- no new hydro or biomass units have appeared in years
- it's not at all aligned with wind on these days
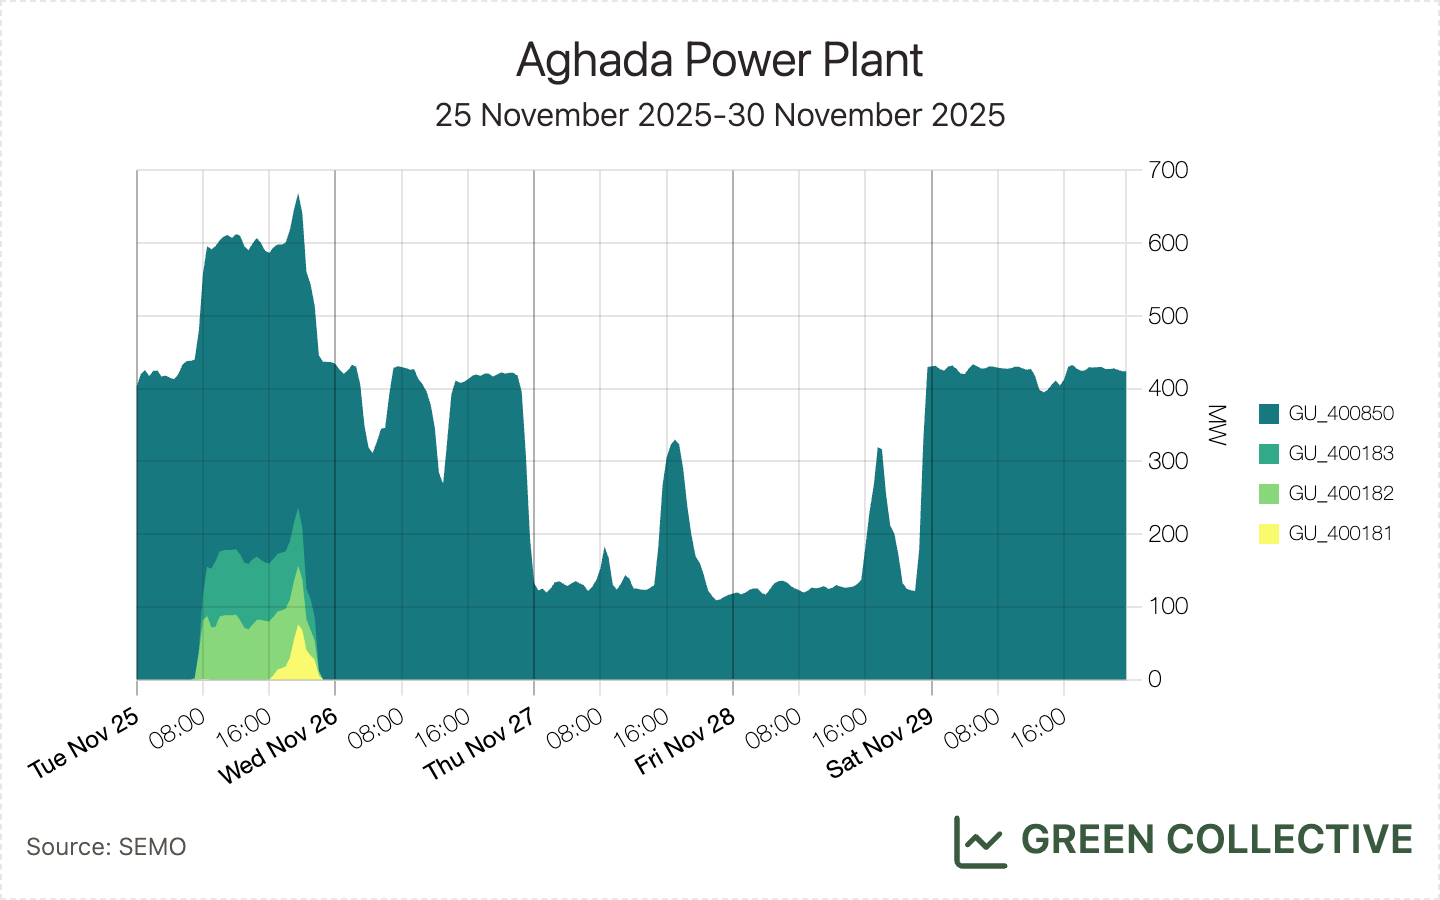
- output is somewhat aligned with gas, i.e. lower on the 27th
So, our best guess is a gas unit and quite possibly a re-assignment of an existing one given the time of day it went into operation. Having cycled laboriously through every gas unit on the island, Cork's Aghada plant stands out: its three older gas units all turned down around 11pm on November 25 and haven't been active since. However, the mystery unit is so far outputting much less power than any of those three units – and we haven't read anything about a change of ownership at Aghada. For now, this mystery unit fortunately doesn't much impact any of our analysis elsewhere in this newsletter. As always, if you know more than we do please reach out to us on hello@greencollective.io.