This article was first sent to our newsletter subscribers. To receive our monthly reports on the 1st of each month, subscribe now for free.
Introduction: Wind in RESS
We included a brief analysis of solar in RESS auctions in our last monthly recap, as 80% of the awarded capacity in the most recent RESS 5 auction were solar farms. This month, we're reviewing the status of wind capacity in RESS (many thanks to the subscriber who sent a message and asked about wind attrition rate in RESS!).
As we did for solar, we cross-referenced awarded wind capacity in all five RESS auctions with energised and contracted lists from EirGrid and ESB Networks. The chart below shows the status of awarded wind capacity: we note the amount of capacity that’s energised or contracted and whether it’s at transmission or distribution levels. When capacity is categorised as n/a, it means it’s currently not part of any energised or contracted lists. If capacity is listed as n/a in earlier RESS auctions, it’s likely such capacity would not materialise at this point.
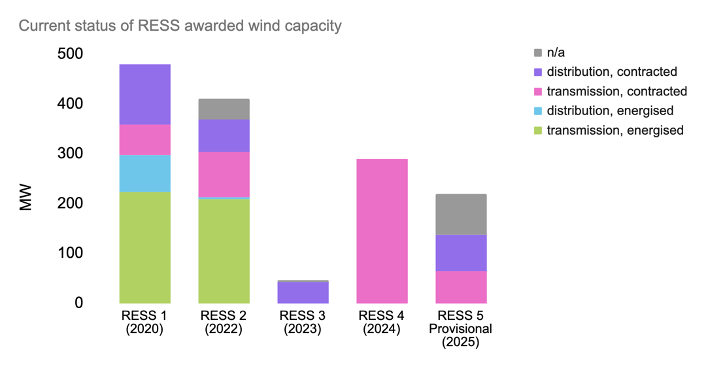
It's worth noting the long-stop date for RESS 1 was December 2023. As of Q3 2025, 38% of awarded wind capacity in RESS 1 is still listed as contracted. Coincidentally, 38% of awarded solar capacity in RESS 1 is also listed as either contracted still or deemed unrealised due to the lack of progress.
Similar to some awarded solar capacity, a handful of wind farms also re-entered a more recent RESS auction with a new deadline. The most notable one is Yellow River: it originally appeared in RESS 2 and again in RESS 3. This wind farm in Offaly energised in late 2024.
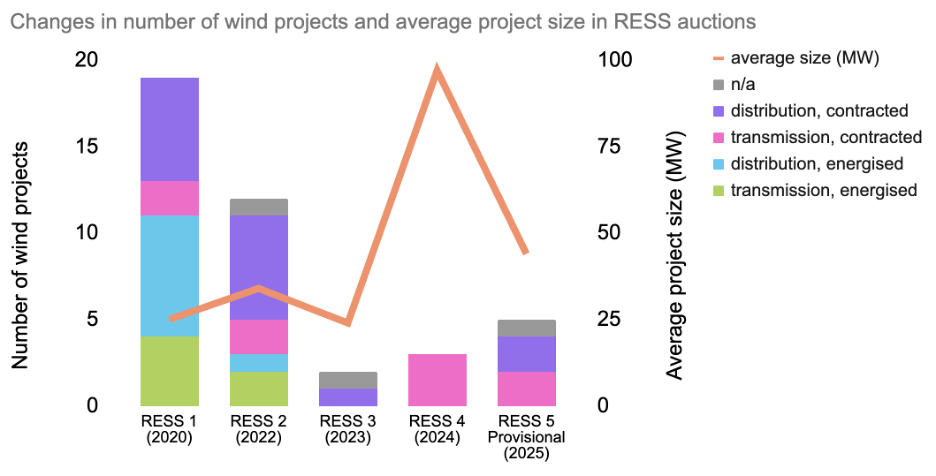
Like solar, the number of projects awarded is much lower in recent auctions compared to earlier auctions, as the chart above demonstrates. But unlike solar, where average project size has steadily increased in recent auctions, the changes in average wind project size is more erratic, with a spike in RESS 4: wind projects awarded in RESS 4 range from 60MW to 139MW.
When we treat RESS 1 capacity still listed as contracted as unrealised, unless they have re-entered a later auction, the attrition rates of wind and solar in RESS 1 are 20% and 29% respectively. Out of the 1.3GW of awarded capacity in RESS 1, around 800MW are energised and more than 140MW are now part of a later auction. The rest is either contracted or unrealised. If anyone has knowledge and thinks there's hope that contracted capacity under RESS 1 could still come online long after the deadline, please let us know! For now, though, we're inclined to think such contracted capacity are highly unlikely to materialise at this point.
Now, onto all the October stats.
Summary
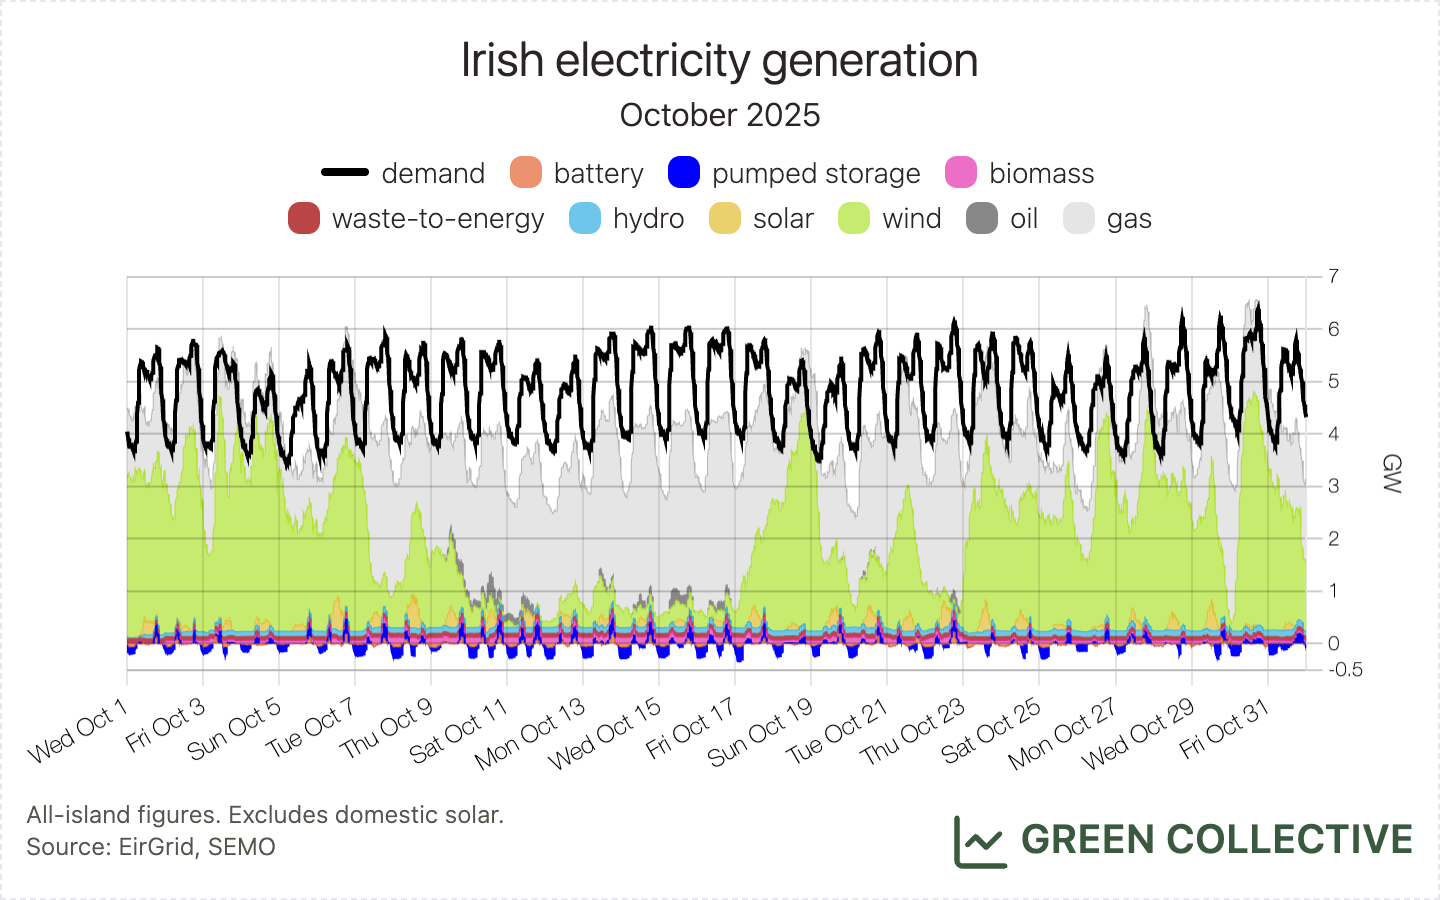
October 2025 started and ended strongly for renewable generation in Ireland, with Storm Amy resulting in some of the best overall October days for wind and Hallowe'en seeing some new instantaneous October highs. However, these periods bookended a prolonged period of low winds from the 10th through the 17th – the dreaded Dunkelflaute – during which we saw some of the worst days for renewable generation in several years. In other words, October 2025 was generally a strong month for renewable generation but without any records for the month as a whole.
However, we did see records in terms of fossil fuel generation: the lowest amount of fossil fuel generation (and, by extension, carbon emissions) in an October month, by some distance. This is partly due to strong renewable generation but mostly due to increased imports from the GB grid. While we're happy to see imports from the relatively clean GB grid supplant fossil fuel generation here (and this does appear to be the case most of the time), we're increasingly aware of periods during which imports may also be supplanting some renewable generation.
More on that later; for now, let's finish this introduction with some positive news:
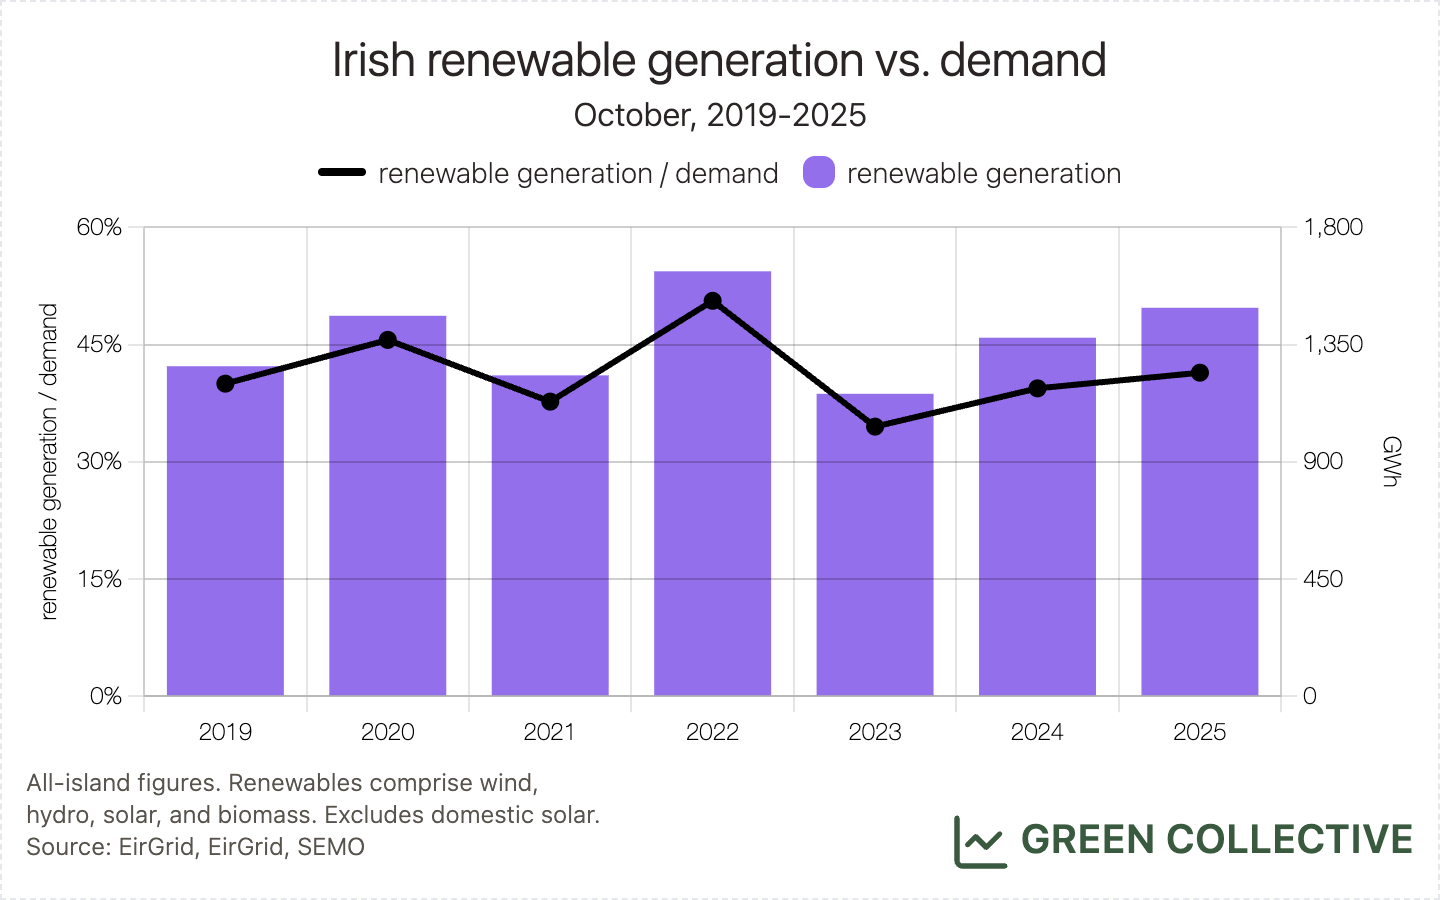
- On the morning of October 19, renewable generation briefly exceeded total electricity demand around 1am. This has been happening sporadically in the winter months since 2021 but it has now happened, for the first time, at least once for three months in a row.
- This was the closest renewable generation has ever come to exceeding fossil fuel generation in an October month. This happened in September and although it was neck and neck in the last few days, it wasn't to be. Thanks, Dunkelflaute.

Wind
1299.2GWh of wind generation was equivalent to 36.1% of electricity demand. Both figures are the third highest for wind in an October month.
As mentioned earlier, although a lengthy Dunkelflaute scuppered any chance of month-long records for wind we did see some notable highs:
- October 4 saw 81GWh of wind generation, the most ever in a single October day. This was enough to satisfy 77.1% of electricity demand, the second-highest ever ratio for an October day.
- Early in the morning on Sunday, October 19, wind generation reached 97.6% of electricity demand. This was a new instantaneous high for October wind.
- On Thursday, October 30, wind output reached 4484MW. This was a new wind output high for October.
We can surely – at least in part – attribute these new highs to a couple of large new wind farms which have started reaching their peak output over the past couple of months. More on these and where they're situated below. We anticipate further instantaneous records over the winter as both winds and electricity demand peak.
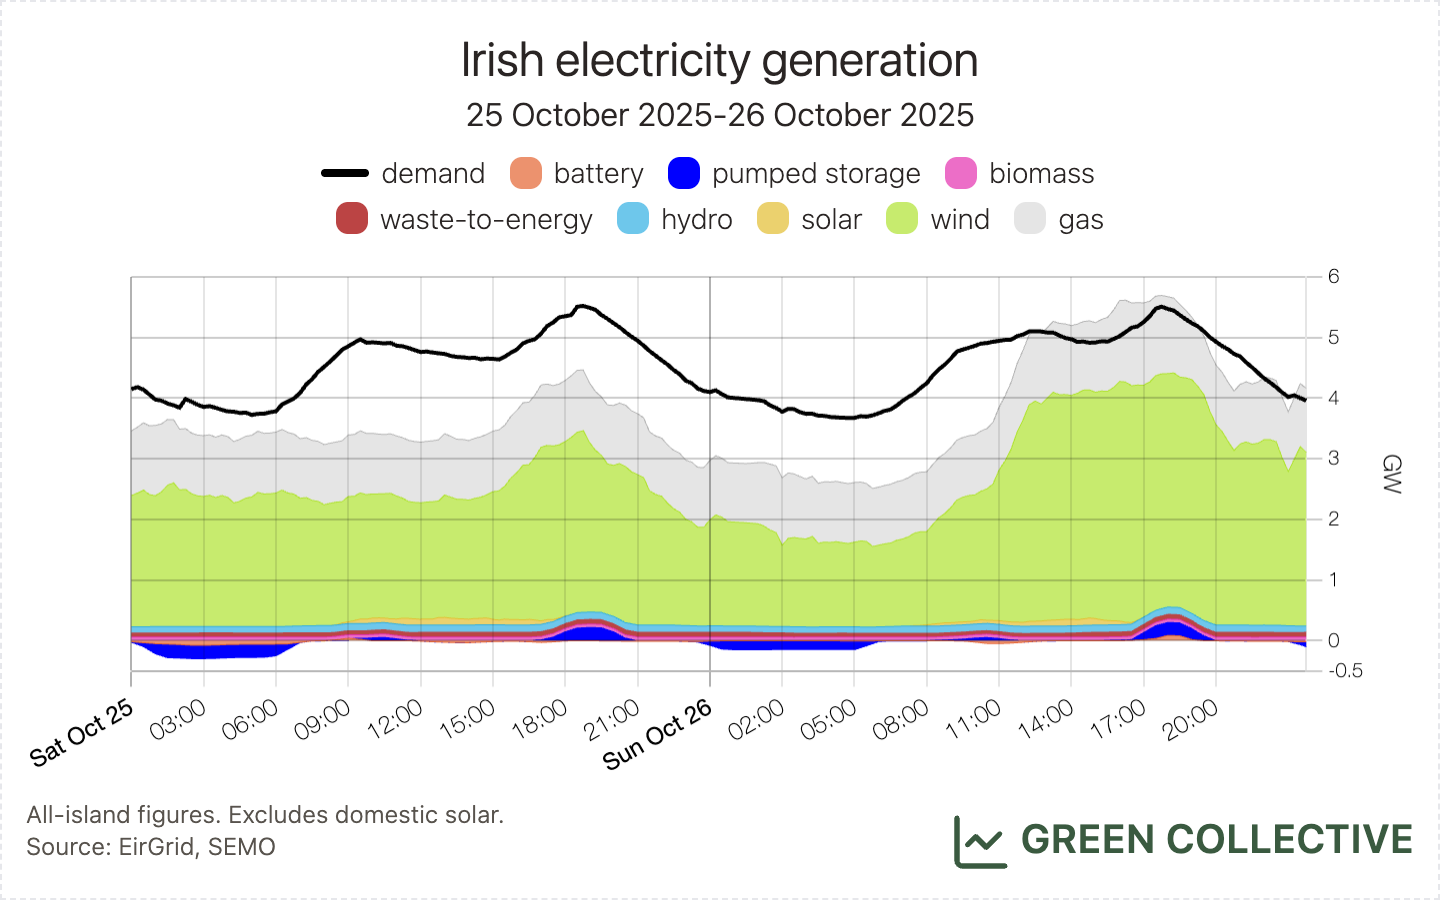
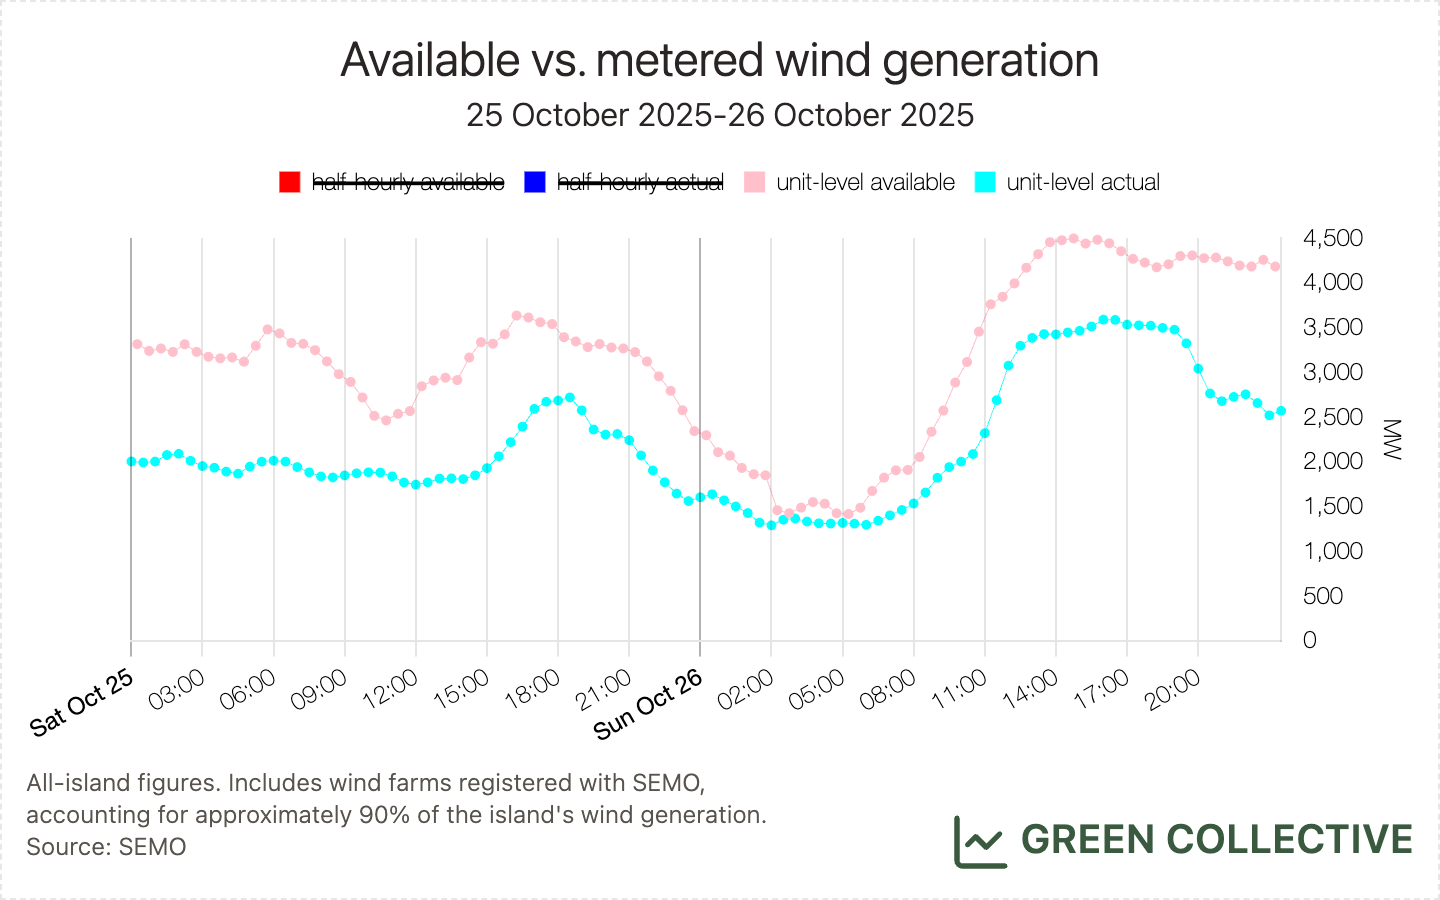
As mentioned above, we have become increasingly aware in recent months of periods of strong wind availability during which imports may be displacing domestic wind generation. October 2025 saw two instructive periods: the weekends of the 4-5 and 25-26, during both of which fossil fuel generation rarely rose above ~1GW, roughly the minimum currently required to maintain system stability. While it's clearly good that fossil fuel generation (and therefore carbon emissions) was minimised, it's harder to understand why domestic wind generation would be ordered to stand down.
Dispatch down is an essential feature of any power grid with renewables – for one thing, there simply isn't enough always demand to make use of all potential generation – but our initial analysis suggests that, over these weekends at least, wind generation was dispatched down not only because of transmission constraints but mostly because of curtailment, i.e. for technical reasons the grid couldn't accept any more wind or solar given the total amount of generation. However, there often was enough demand – but it was being met by imports via the various interconnectors instead. We don't claim to know the full story here and, of course, interconnectors, just like dispatch down, are an essential part of the grid; however, this doesn't seem ideal and suggests an opportunity to improve market design.
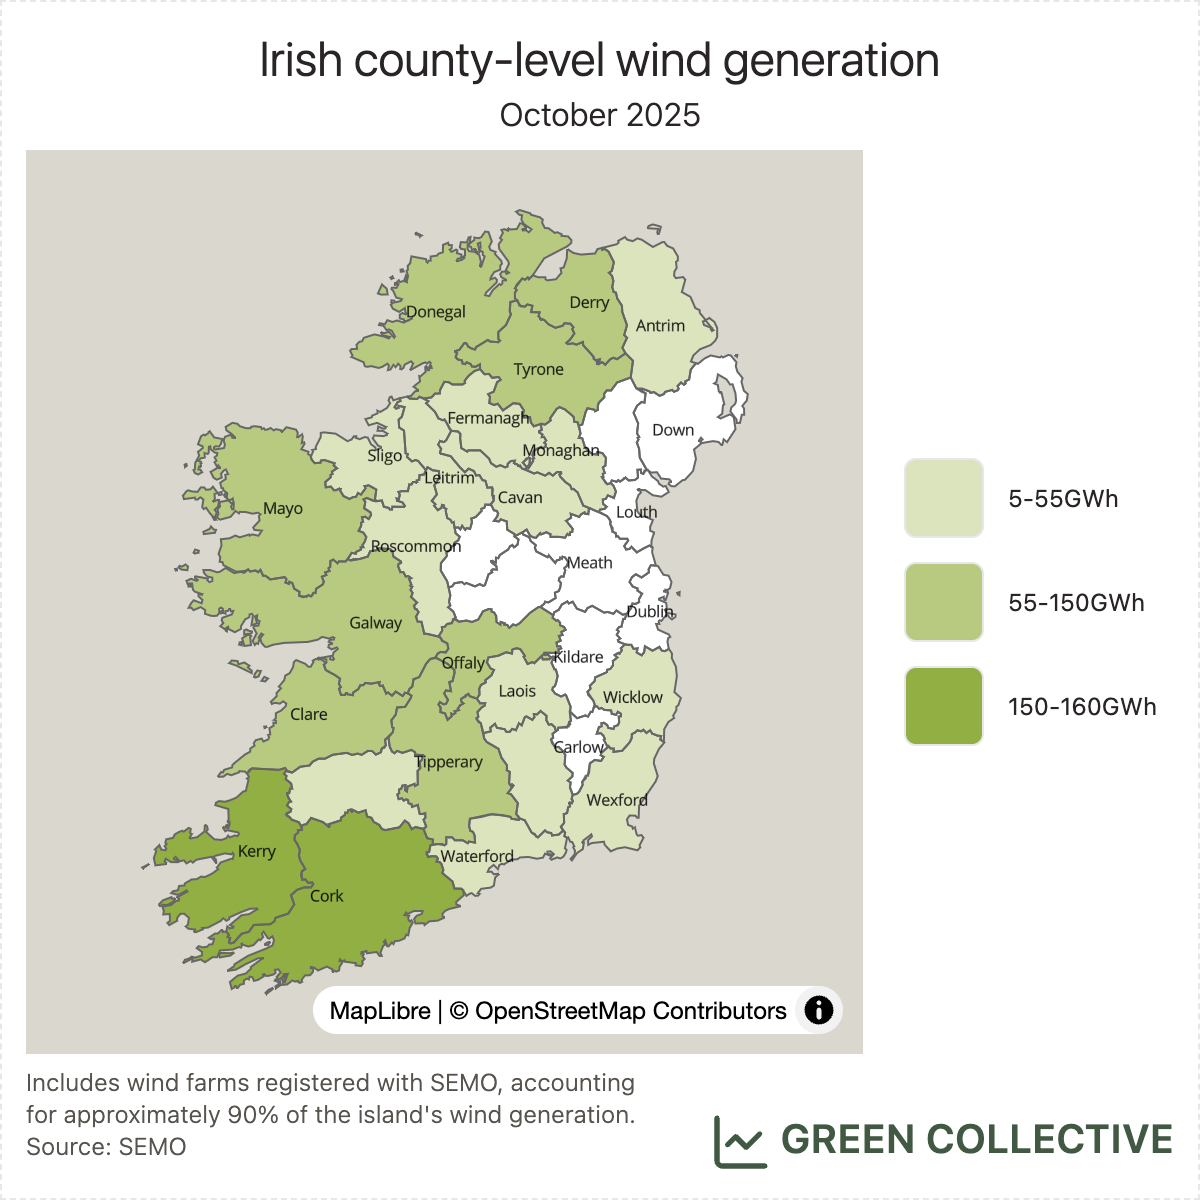
The top wind-producing counties during October 2025:
- Kerry (161.3GWh)
- Cork (151.4GWh)
- Galway (87.2GWh)
- Derry (86.4GWh)
- Tipperary (83.7GWh)
Derry first appeared in the top #5 in August where it has remained since. There, the recently-opened Corlacky Hill Wind Farm, having ramped up in the late summer, is now producing approximately 12GWh per month: more than enough to worry any of the current/previous top #5 regulars of Galway, Mayo, and Offaly. This month, both Offaly and Mayo – despite being home to some of the largest single wind farms – got the boot, with Tipperary making a rare appearance in the top #5. We see no obvious reason why Mayo lost out; for Offaly, its large Yellow River Wind Farm was generally performing below capacity and was offline completely for the last several days of the month, offsetting any gains from the new Cushaling Wind Farm which started reaching its maximum output (approximately the same as Corlacky Hill) during October.
Solar
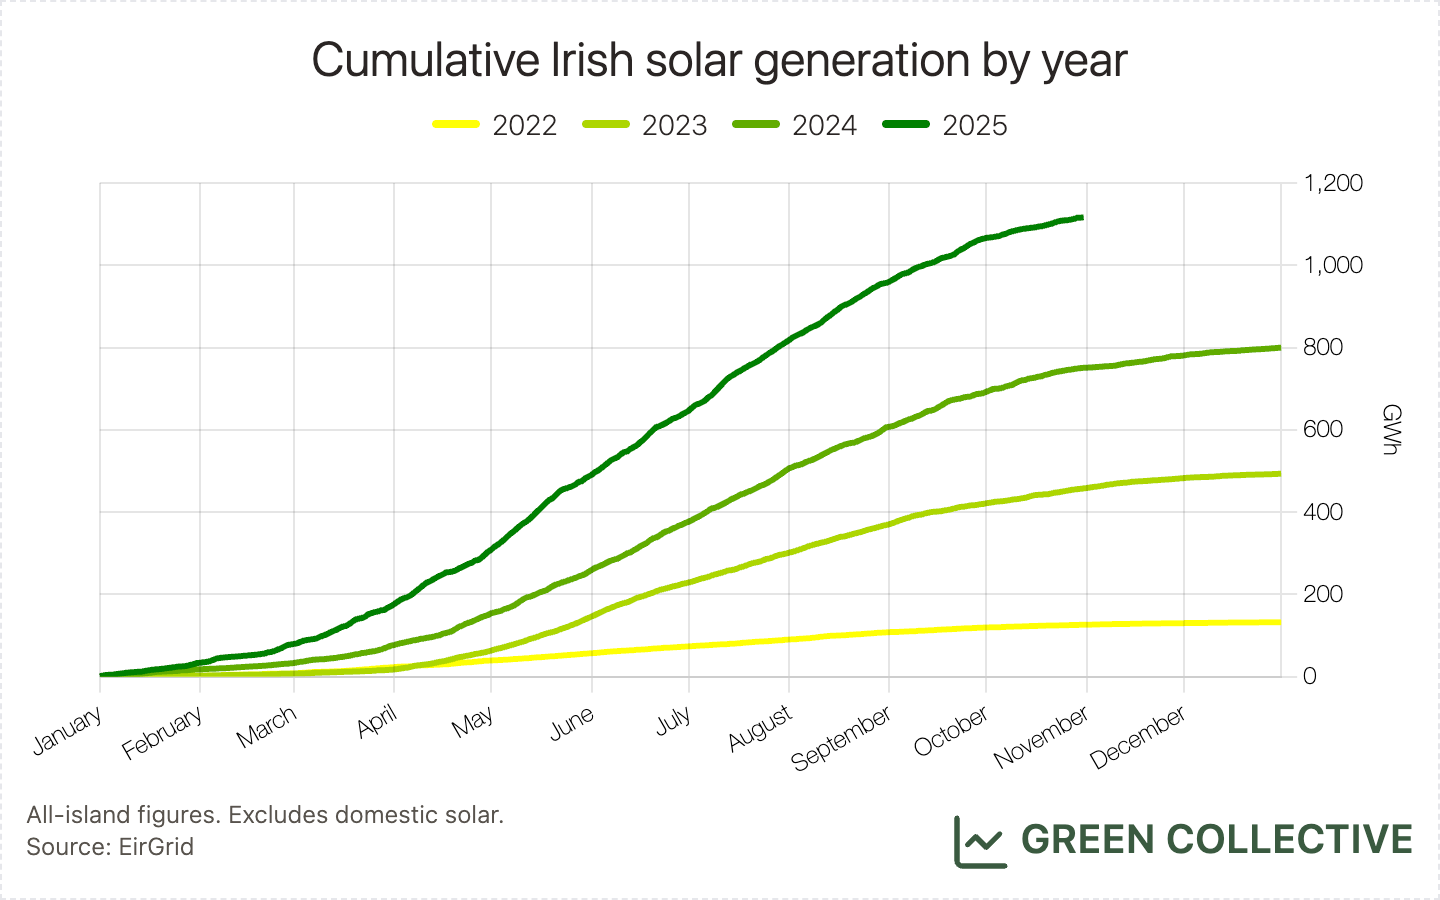
52.1GWh of solar generation was equivalent to 1.4% of all-island electricity demand. Earlier this year, we predicted a "solar record season" running March-September (a prediction borne out with last month's record) but, unfortunately, the solar season has ended with a whimper: October 2025's total was down approximately 16% on October 2024's and in fact represents the first year-on-year drop of any kind since solar burst onto the Irish grid in 2023.
We collect availability and metered generation of wind and solar from SEMO, and dispatch down is calculated as the gap between these two data streams. For wind, we are able to separate the vast majority of estimated dispatch down into different categories, namely constraints and curtailment. However, we suspect there are some data quality issues with solar units (most likely the problems lie with availability data), because we are only able to categorise a small share of estimated dispatch down when it comes to solar units. We will have to wait for EirGrid to publish dispatch down data later in November to figure out what happened to solar constraints and curtailment in October, and we will include an update in the next Irish grid monthly.
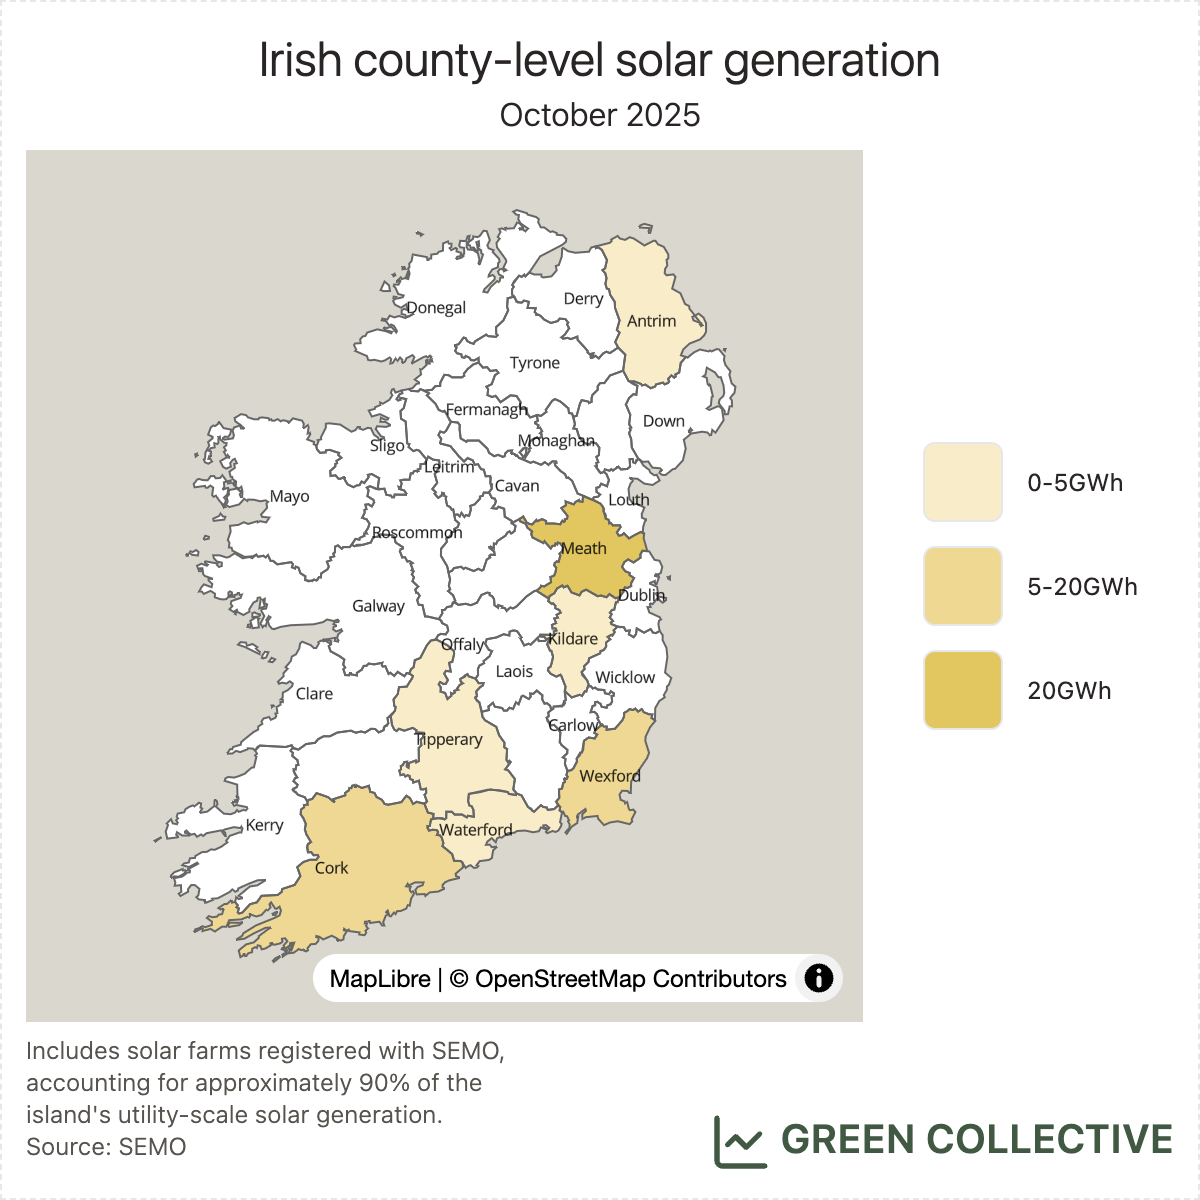
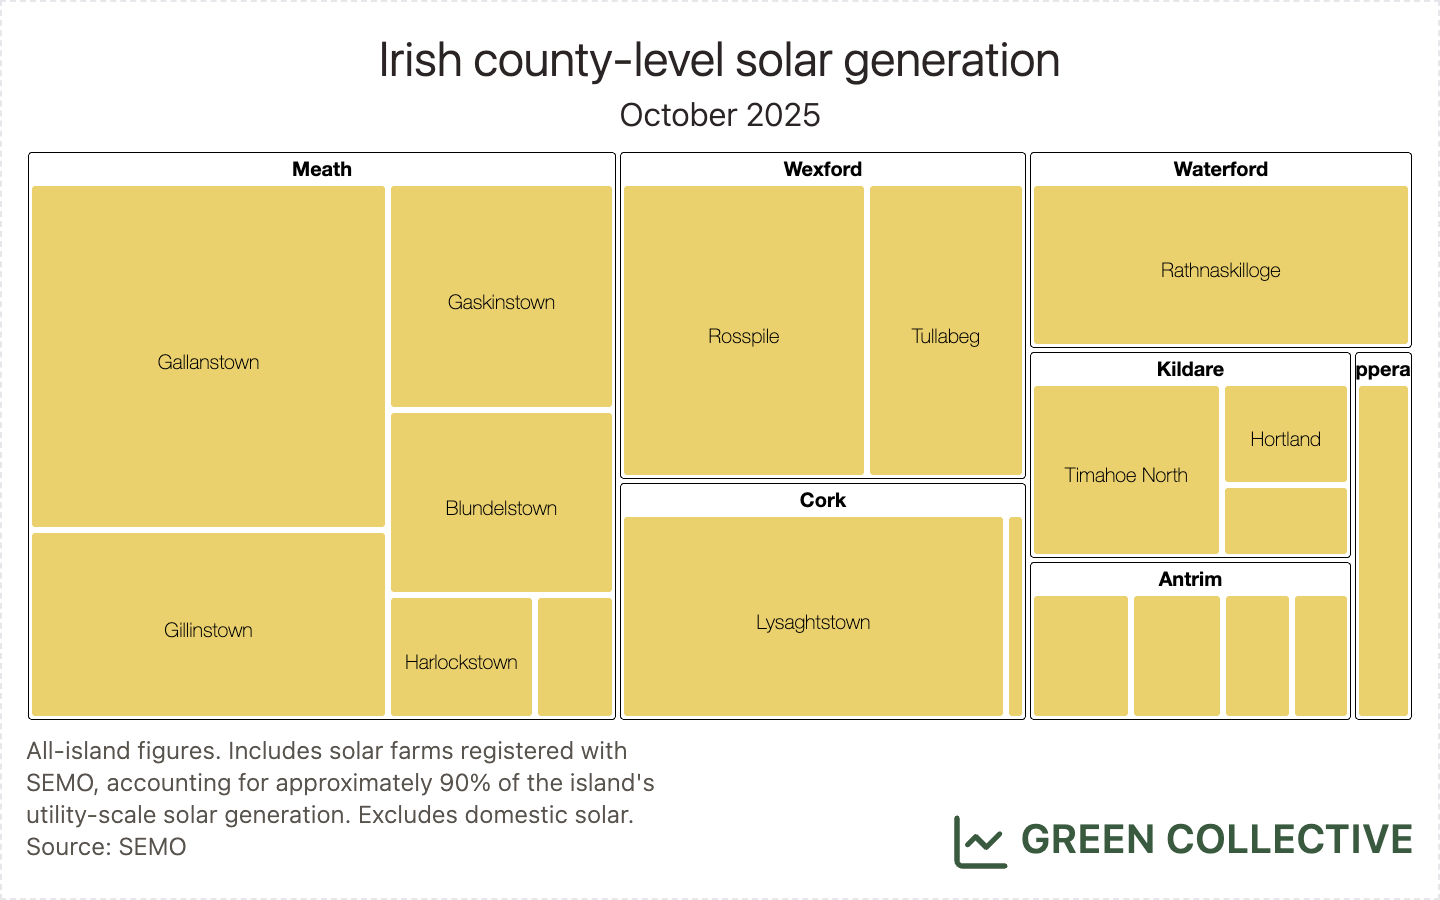
The top solar-producing counties during October 2025:
- Meath (19.2GWh)
- Wexford (7.7GWh)
- Cork (5.7GWh)
These top three counties each month have been virtually unchanged in 2025 – with only the occasional appearance of Kildare #3, ousting Cork – and October 2025 is no exception.
Storage
7.1GWh of discharging battery was by far the highest yet for an October month, at more than 3x that of October 2024's 2.2GWh. However, we didn’t see a new battery discharge record in October, despite witnessing some high prices due to periods of low winds. Theoretically, batteries are likely to cycle more when there are larger differences in prices, so the assets can charge/buy when power is cheap and discharge/sell when it’s expensive. Since October experienced a Dunkelflaute of more than a week, power prices fluctuated greatly, which could have served as an incentive for batteries to participate more in wholesale trading.
But the reality is not many batteries on the island of Ireland cycle regularly to trade in wholesale markets, due to a combination of factors:
- high revenue potential via the DS3 Programme
- high network charges applied to batteries at the moment
- not all operators have the ability to act dynamically in the market
We delved into details of some of these factors that hinder new battery discharge records in our latest Benchmarking Batteries monthly series, in case you missed it.
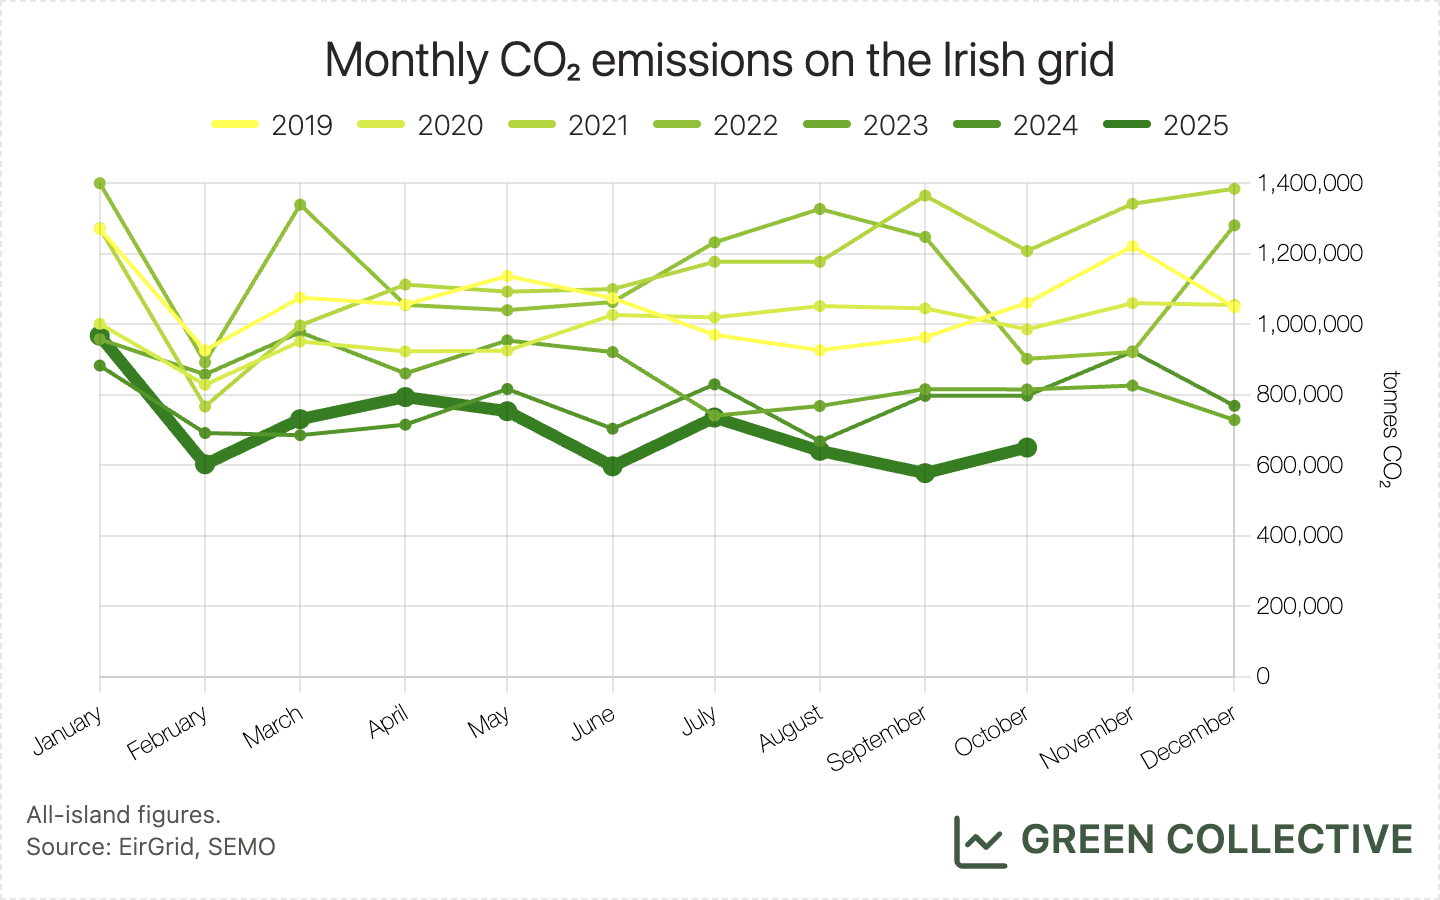
Carbon Emissions
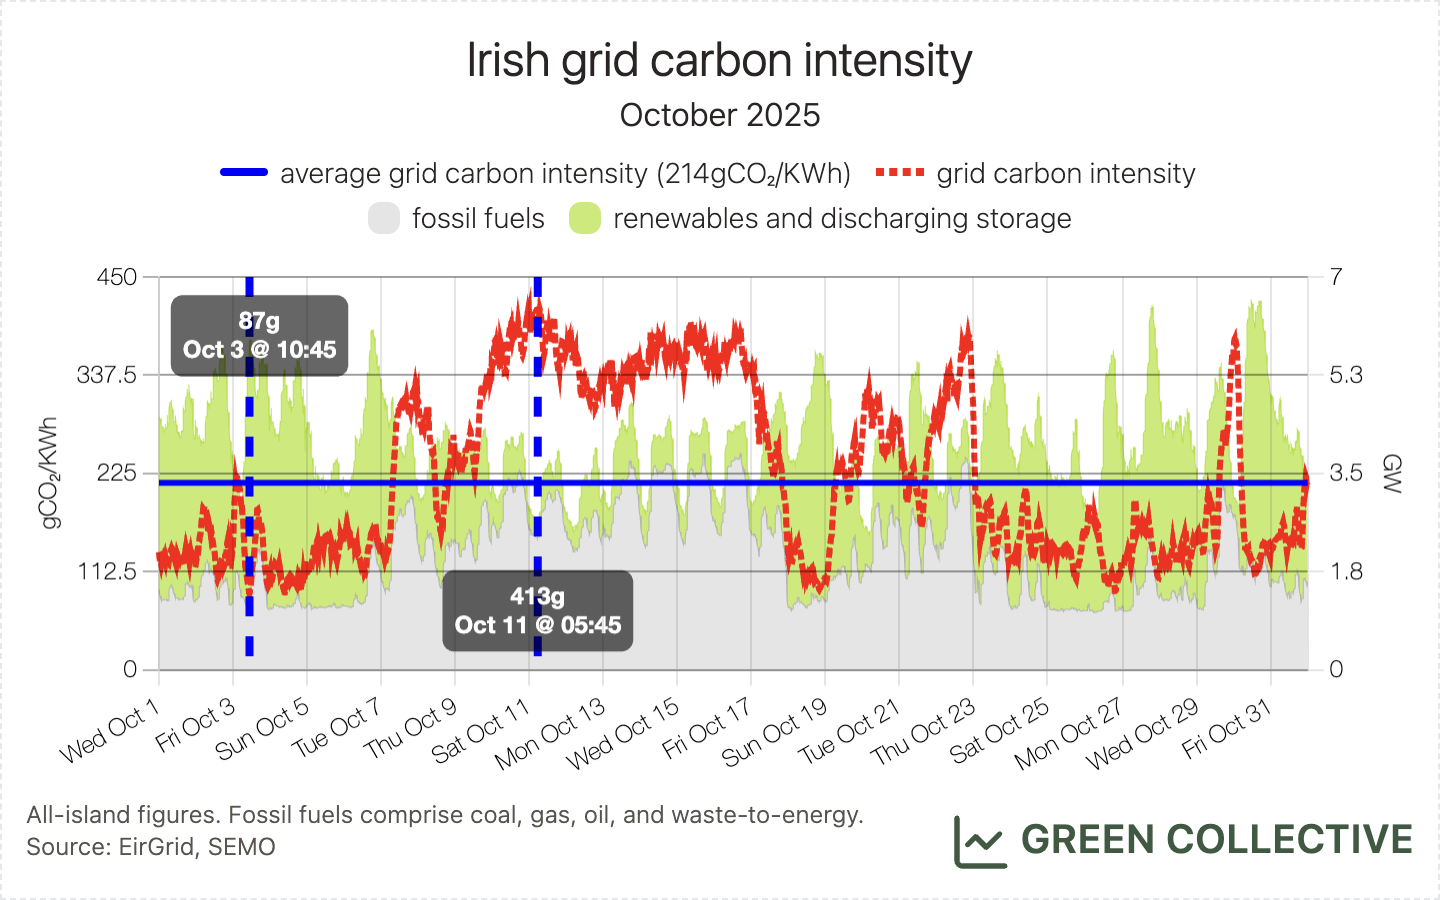
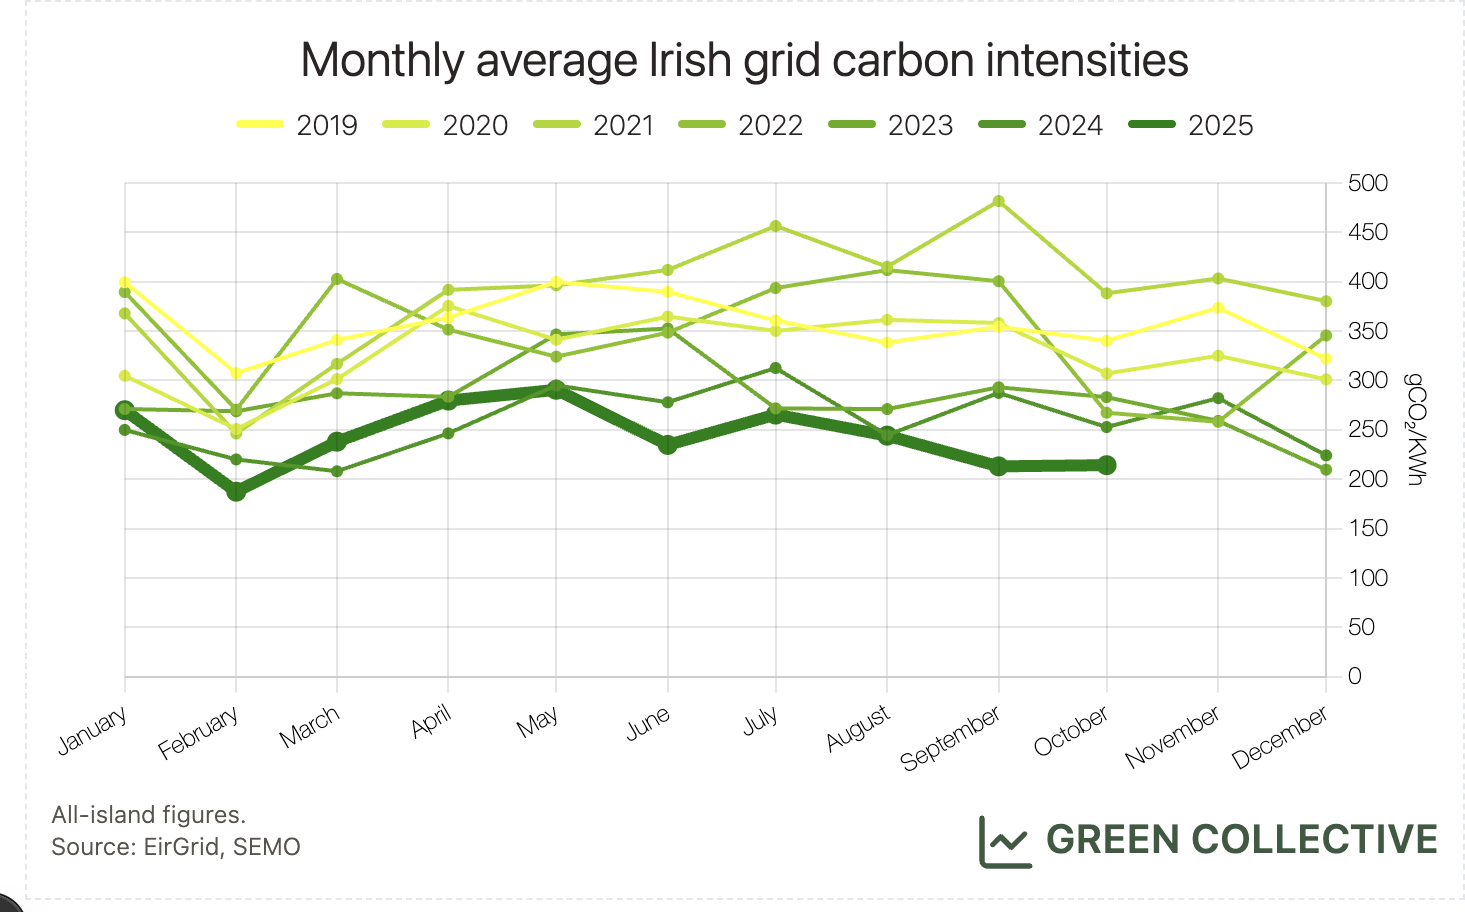
As mentioned above, fossil fuel generation achieved a new low for an October month: we estimate that during October 2025 the Irish grid emitted approximately 650,000 tonnes of CO₂, with grid carbon intensity ranging between 87gCO₂/kWh and 413gCO₂/kWh for an average of 214gCO₂/kWh. This is the lowest monthly average grid carbon intensity for an October month by some distance, well below October 2024's 253gCO₂/kWh.
Hatches & Dispatches
Not much to report on this end for October, but there was a surprise announcement that the Irish Government is going to sign an agreement in 2026 to build an interconnector with Spain, according to RTÉ. Currently there is no additional information on timeline or planned capacity for this interconnector. So far in the webinar series I mentioned at the top of this newsletter issue, interconnectors were discussed in both part 1 and part 2, in case you are interested in watching the recordings.