This article was first sent to our newsletter subscribers. To receive our monthly reports on the 1st of each month, subscribe now for free.
September is usually not a month decorated with records but, to our surprise, the past month witnessed multiple notable new highs and lows: highest solar output, highest battery discharge, lowest total carbon emissions, just to name a few.
We will delve into all those details below but, before that, it’s also worth noting some key updates in September on renewable electricity support schemes (RESS) in both the Republic of Ireland (provisional results from RESS 5 auction) and Northern Ireland (final scheme design with a timeline for the first auction scheduled in 2027).
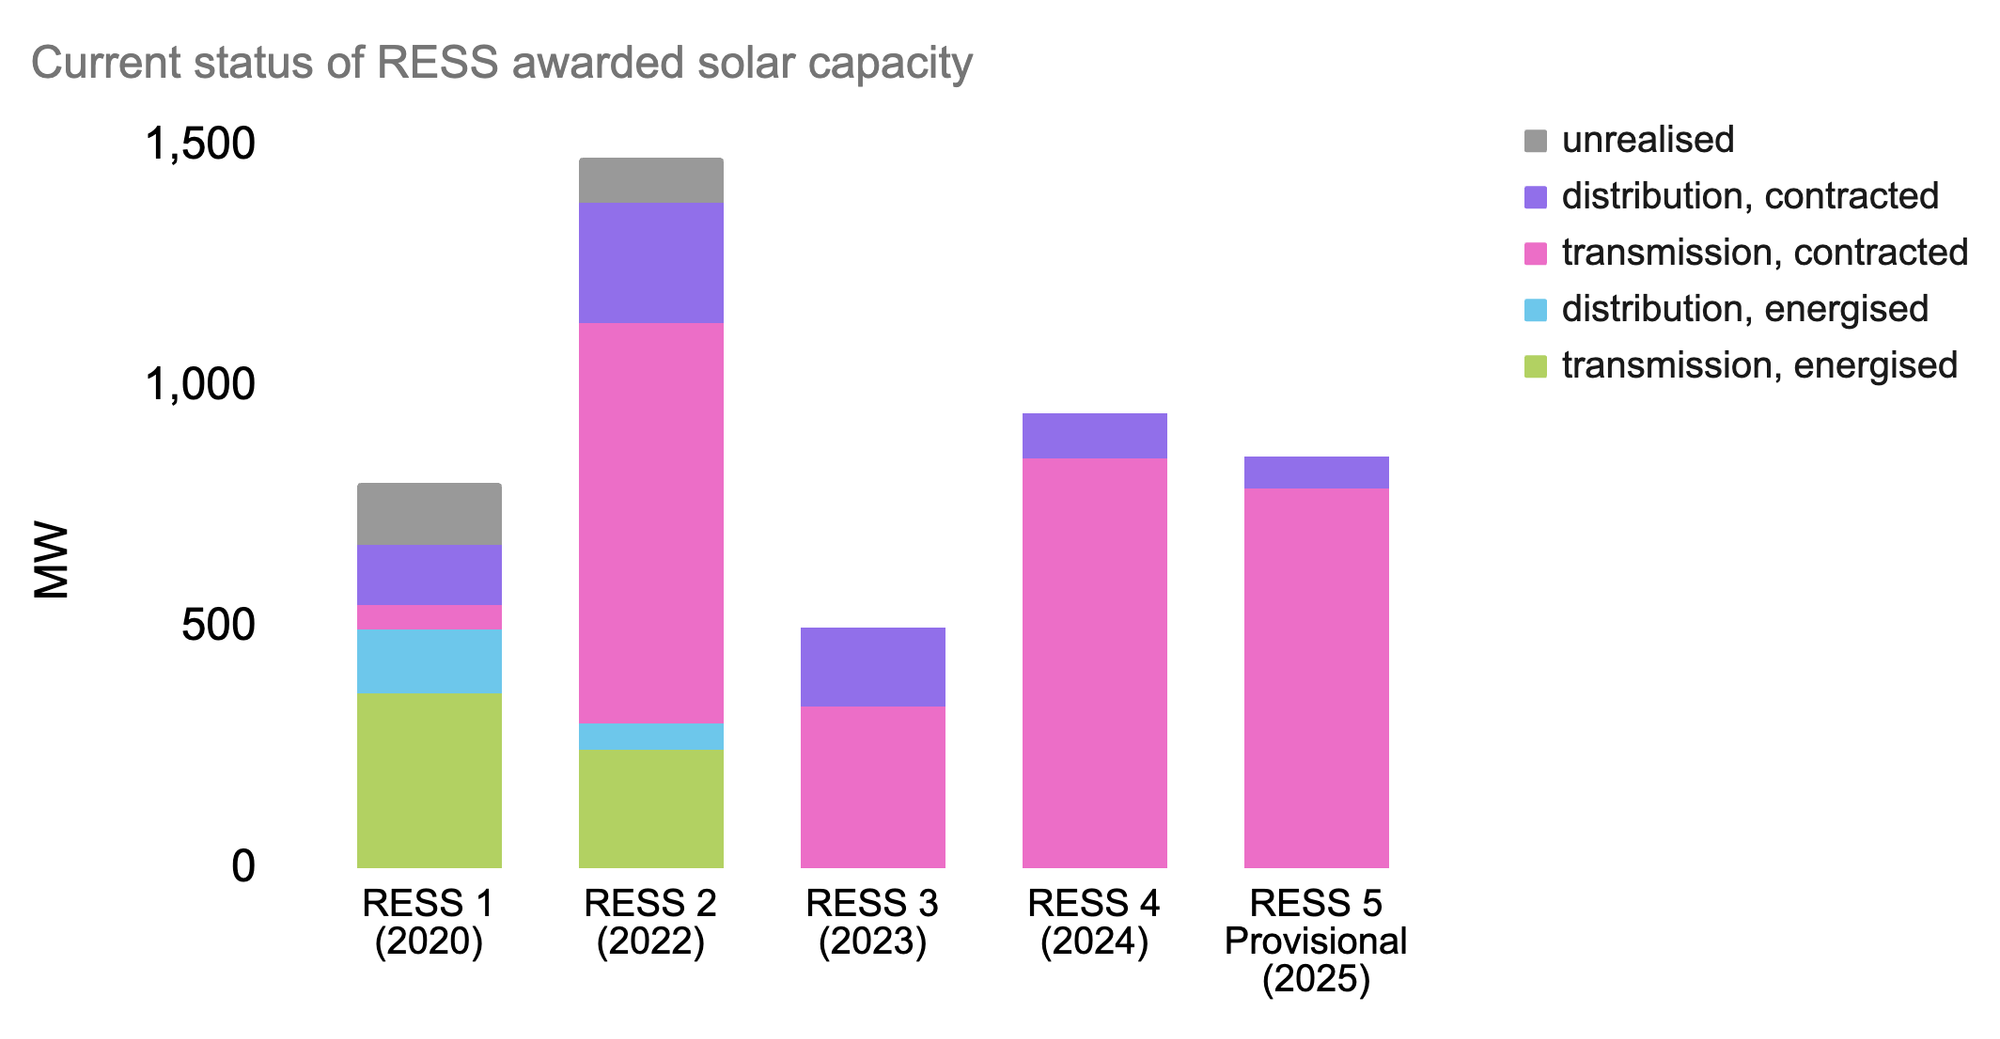
Provisional results from RESS 5 show 80% of awarded capacity is solar. We cross-referenced awarded solar capacity in all five RESS auctions with energised and contracted lists according to EirGrid and ESB Networks, as we illustrate the realistic path from RESS auctions to generating capacity. The chart below shows the current state of awarded solar capacity. We note whether capacity is energised or contracted, as well as whether it's at transmission or distribution level. Unrealised capacity indicate projects that will not be built due to lack of progress.
 Source: EirGrid and ESB Networks via Green Collective
As expected, all capacity awarded in more recent RESS auctions falls under the contracted category, so examining the status of RESS 1 and RESS 2 provides more insights. Capacity awarded in RESS 1 needed to achieve commercial operations by the end of 2023 and that deadline for RESS 2 is December 2025. To date, 16% of RESS 1 capacity has been determined as unrealised and 6% for RESS 2.
It's also important to point out that it's been more than a year since the long stop date of December 2023 for RESS 1, and some projects from RESS 1 had to join a more recent RESS auction with a new deadline. However, ESB Networks still lists 105MW of solar belonging exclusively to RESS 1 as contracted, when the deadline for energisation for these projects has been long past. If none in this capacity group comes online, the unrealised rate of RESS 1 solar capacity would reach 29%.
 Source: EirGrid and ESB Networks via Green Collective
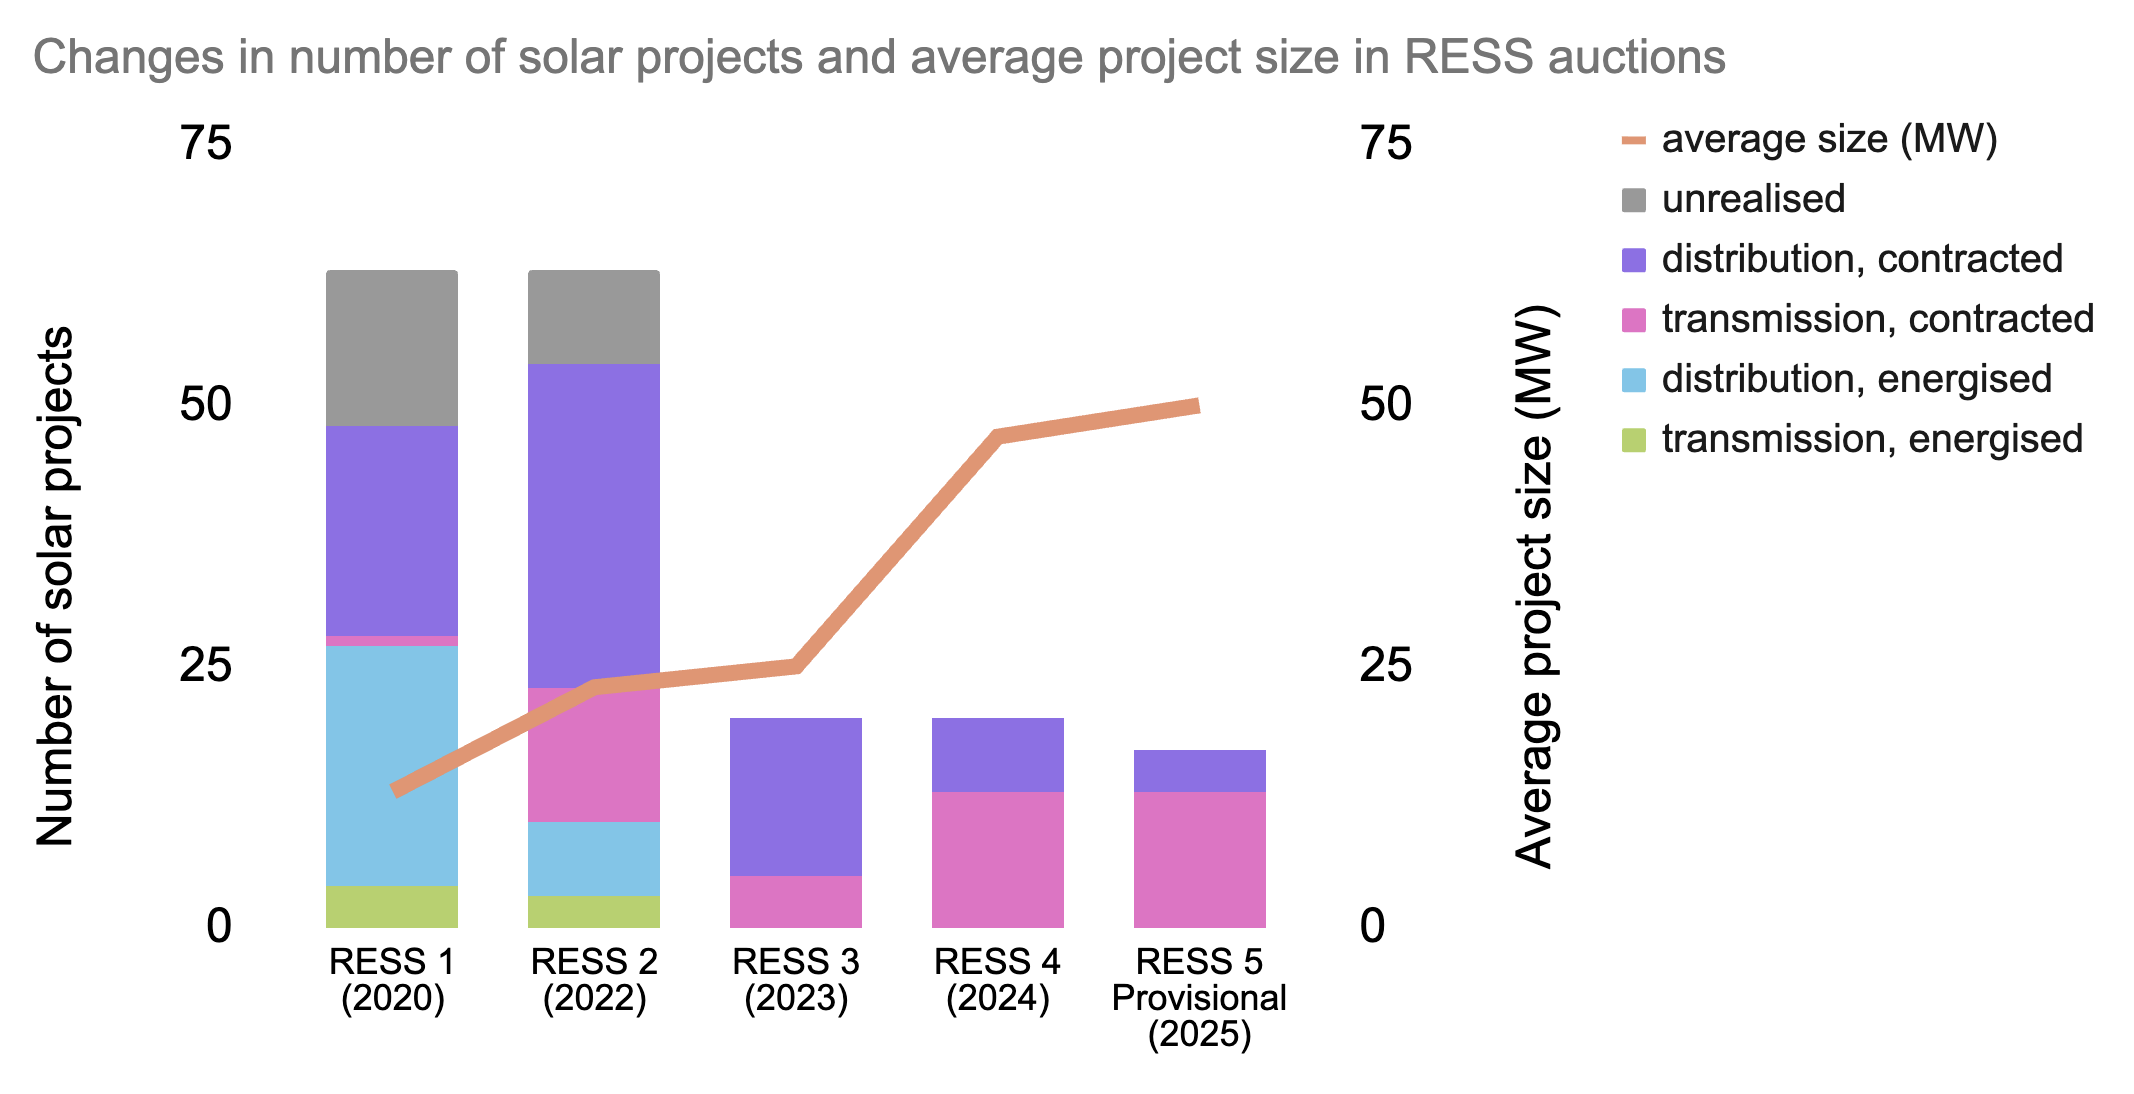
Another key finding when we compare results from all five RESS auctions is how the type of solar projects has changed. As shown above, when we look at the number of projects, the first three auctions were dominated by distribution-level solar farms, which tend to be much smaller in size compared to transmission-level projects. In fact, average solar project size in RESS 1 was 13MW and that increased to 50MW in the most recent RESS 5, due to the fact that a much greater share of projects plans to connect at transmission level.
If early RESS awardees teach us anything, it's that not all capacity will make it on the grid, but the majority of them will. We hope to see the unrealised rate minimised and will keep track of any status changes for all the contracted capacity.
Now onto all the records we took note of in September 2025!
Summary
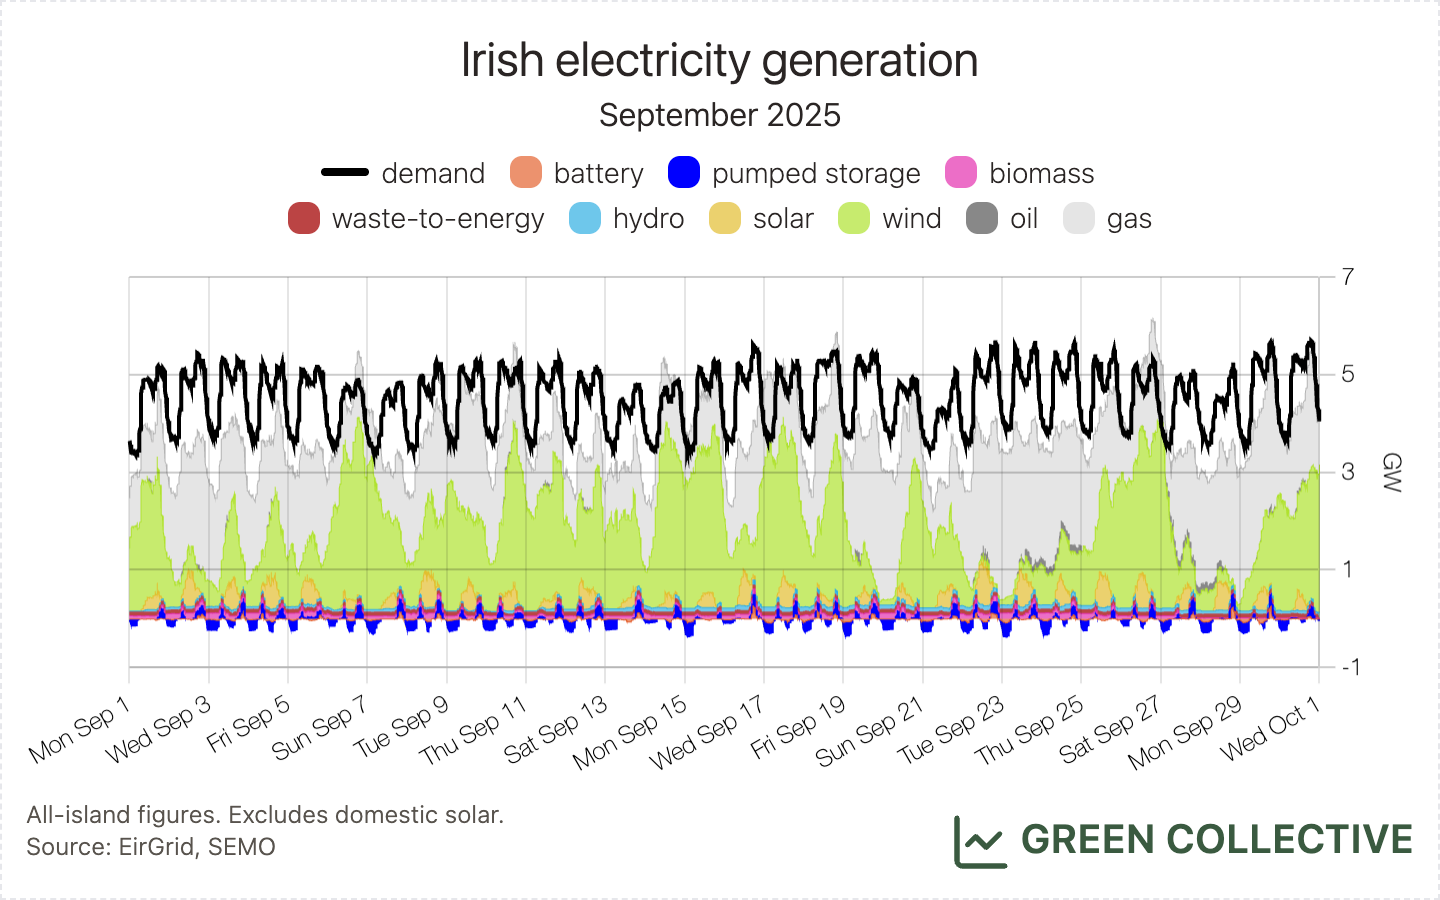
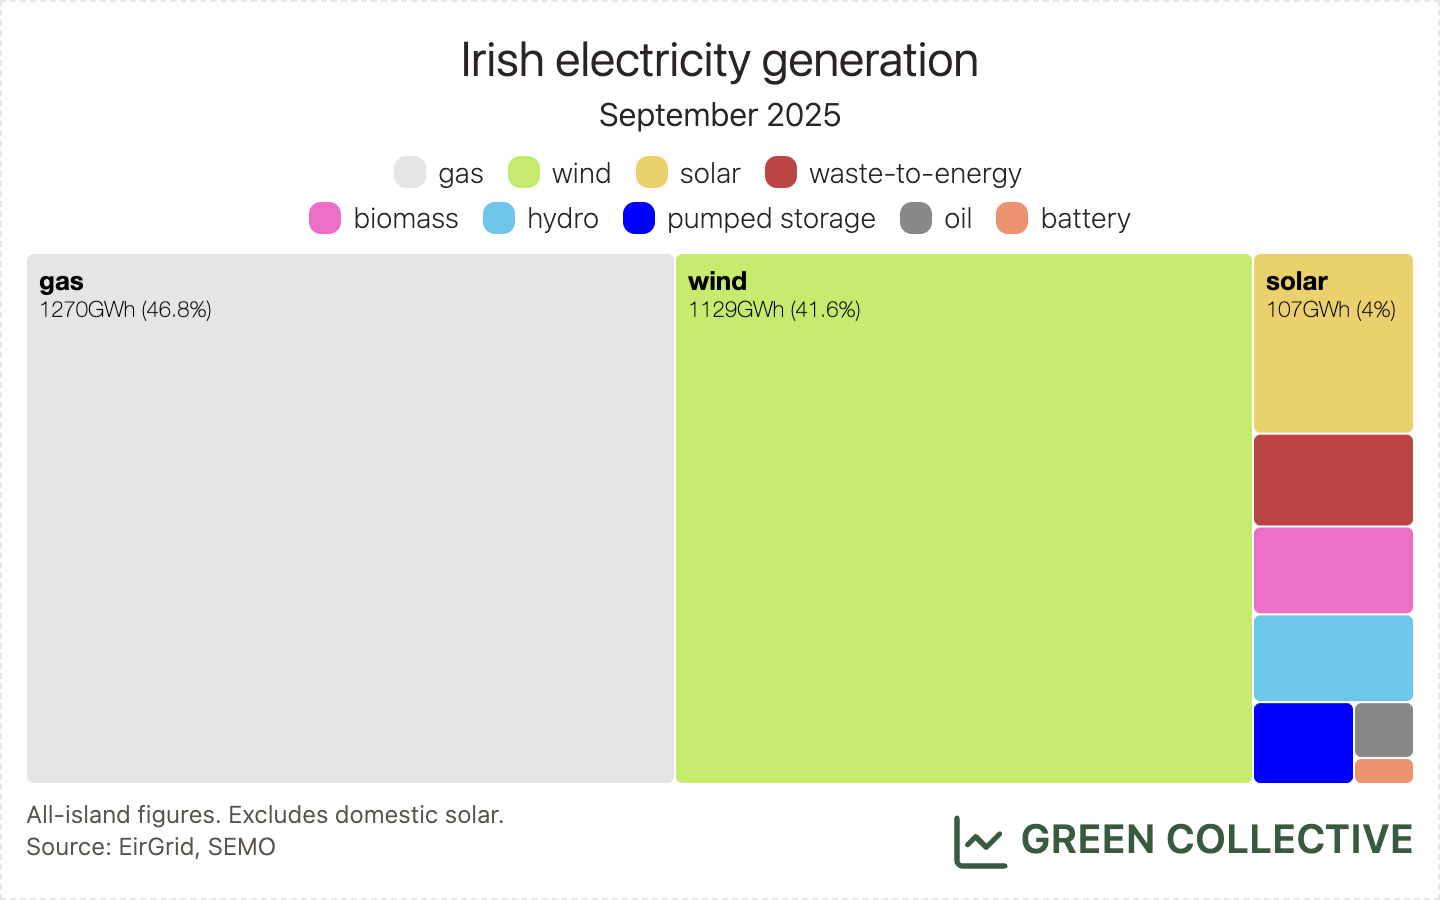
Renewable generation in Ireland during September 2025 was equivalent to 41% of all-island electricity demand, fossil fuels 40.9%, and imports 18.2%. This was the highest share for renewables in any September month to date. This is also the first time renewable generation has exceeded fossil fuel generation – just! – in not only a September month but any month outside of winter (usually February, but also once each for December and March).
The percentage of demand covered by each source:
- renewables:
- wind: 34.5%
- solar: 3.3%
- hydro: 1.6%
- biomass: 1.6%
- fossil fuels:
- gas: 38.8%
- waste-to-energy: 1.7%
- oil: 0.4%
- storage:
- pumped storage: 0.9%
- batteries: 0.2%
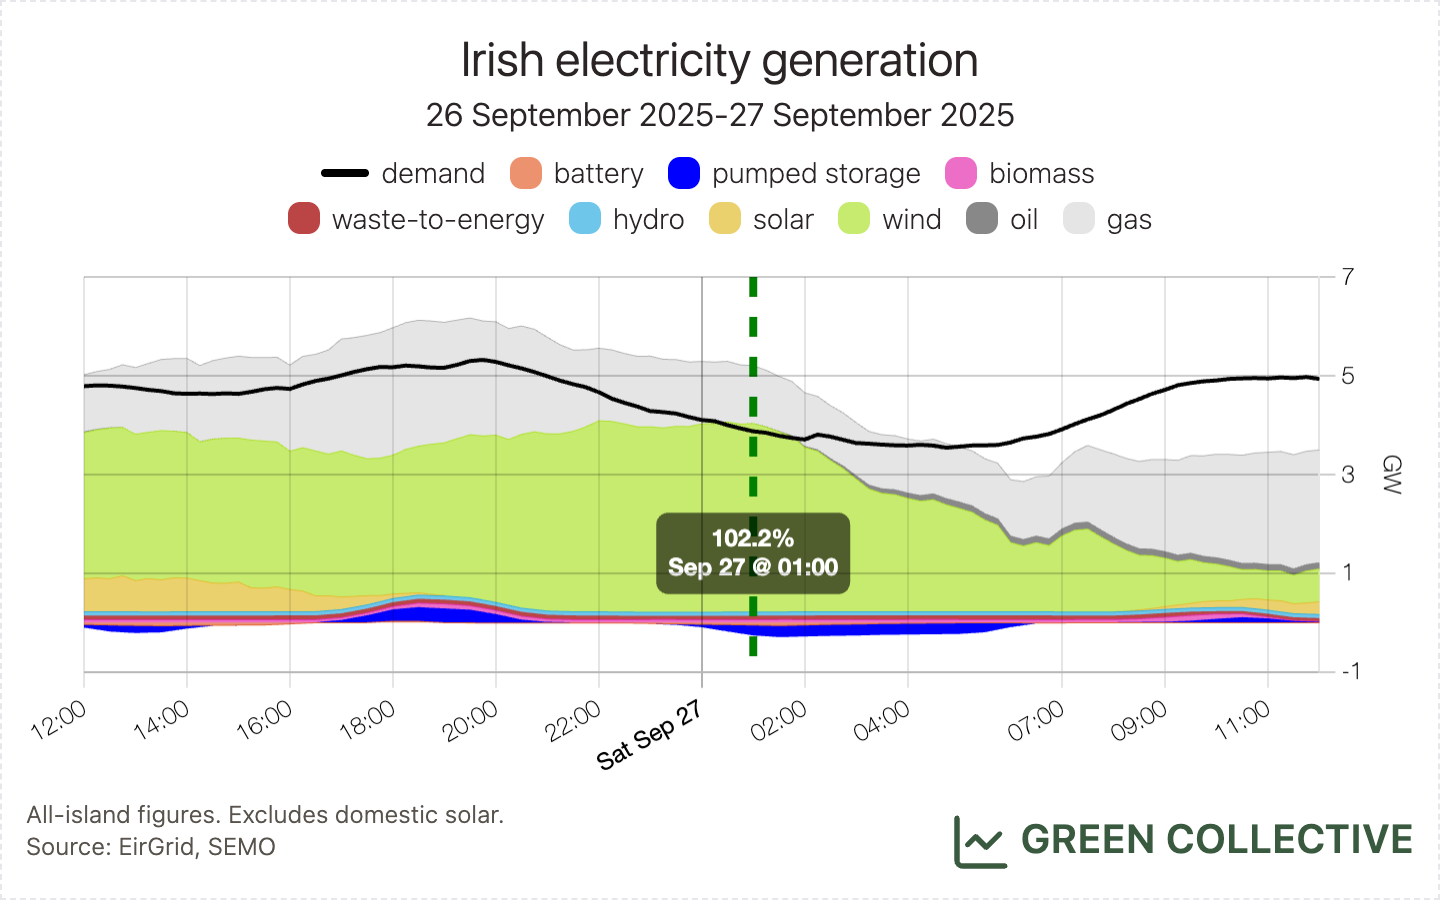
On the morning of Saturday, September 27, we saw renewable generation briefly exceeding 100% of all-island electricity demand, peaking at 102.2% of demand. This is still rare outside of the winter: we saw it in August and September 2023, only during the winter in 2024, and now again in both August (we forgot to mention it in last month's newsletter) and September 2025.
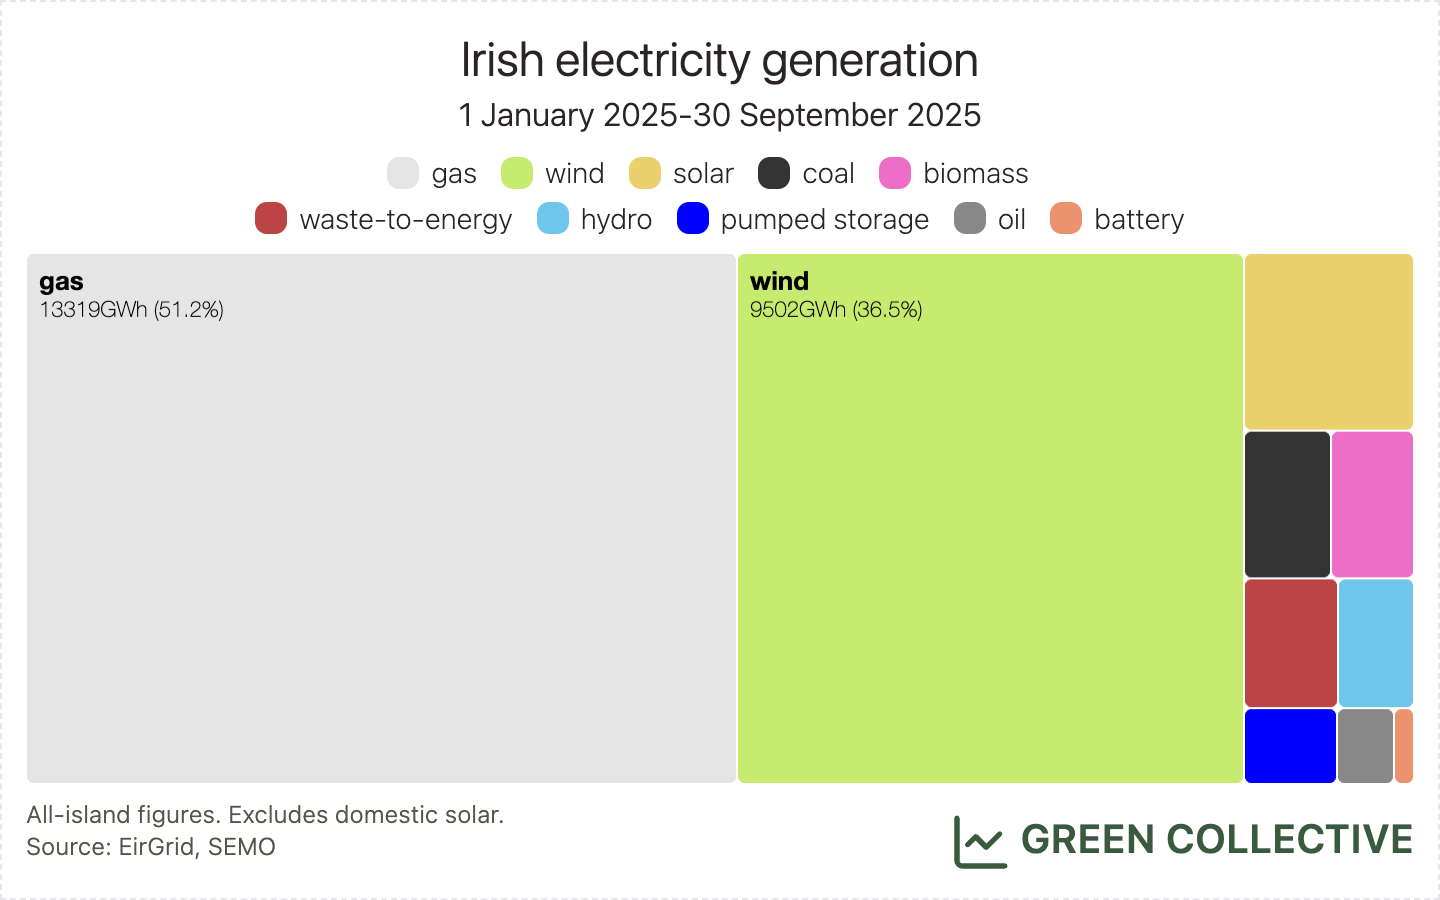
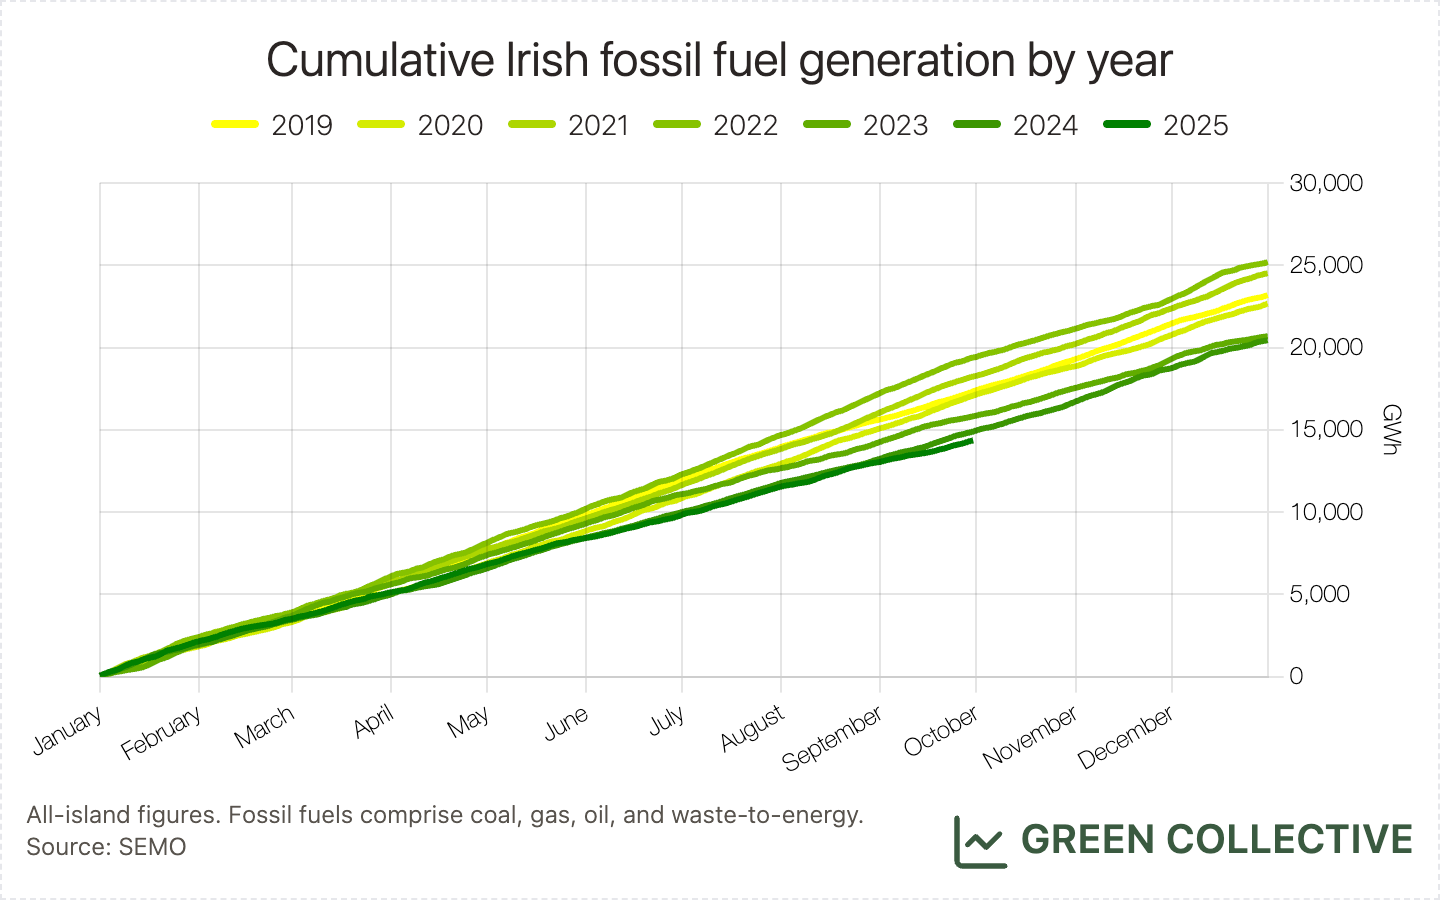
So far in 2025, renewable generation has equalled 37.2% of all-island electricity demand, fossil fuels 47.1%, and imports 14.9%. In terms of TWh, 11.4TWh from renewables is the most yet seen in one year by the end of Q3 while 14.4TWh from fossil fuels is the lowest yet seen in any year by the end of Q3. Comparing the past several years of fossil fuel generation, we can see it has fallen approximately 20% since 2019.
Wind
1128.7GWh of wind generation was equivalent to 34.5% of all-island electricity demand. This is the first time wind has generated more than 1TWh in a September month – just beating September 2023's 996.6GWh – and it was wind's highest share of demand for any September month, beating September 2023's 31.9%.
Interestingly, we looked and looked for any notable highs or lows for wind during the month but, no, it was just generally strong generation throughout the month which is additionally impressive when we consider that Offaly's Yellow River Wind Farm – one of the largest on the island – remained offline for the vast majority of the month; more on that below.
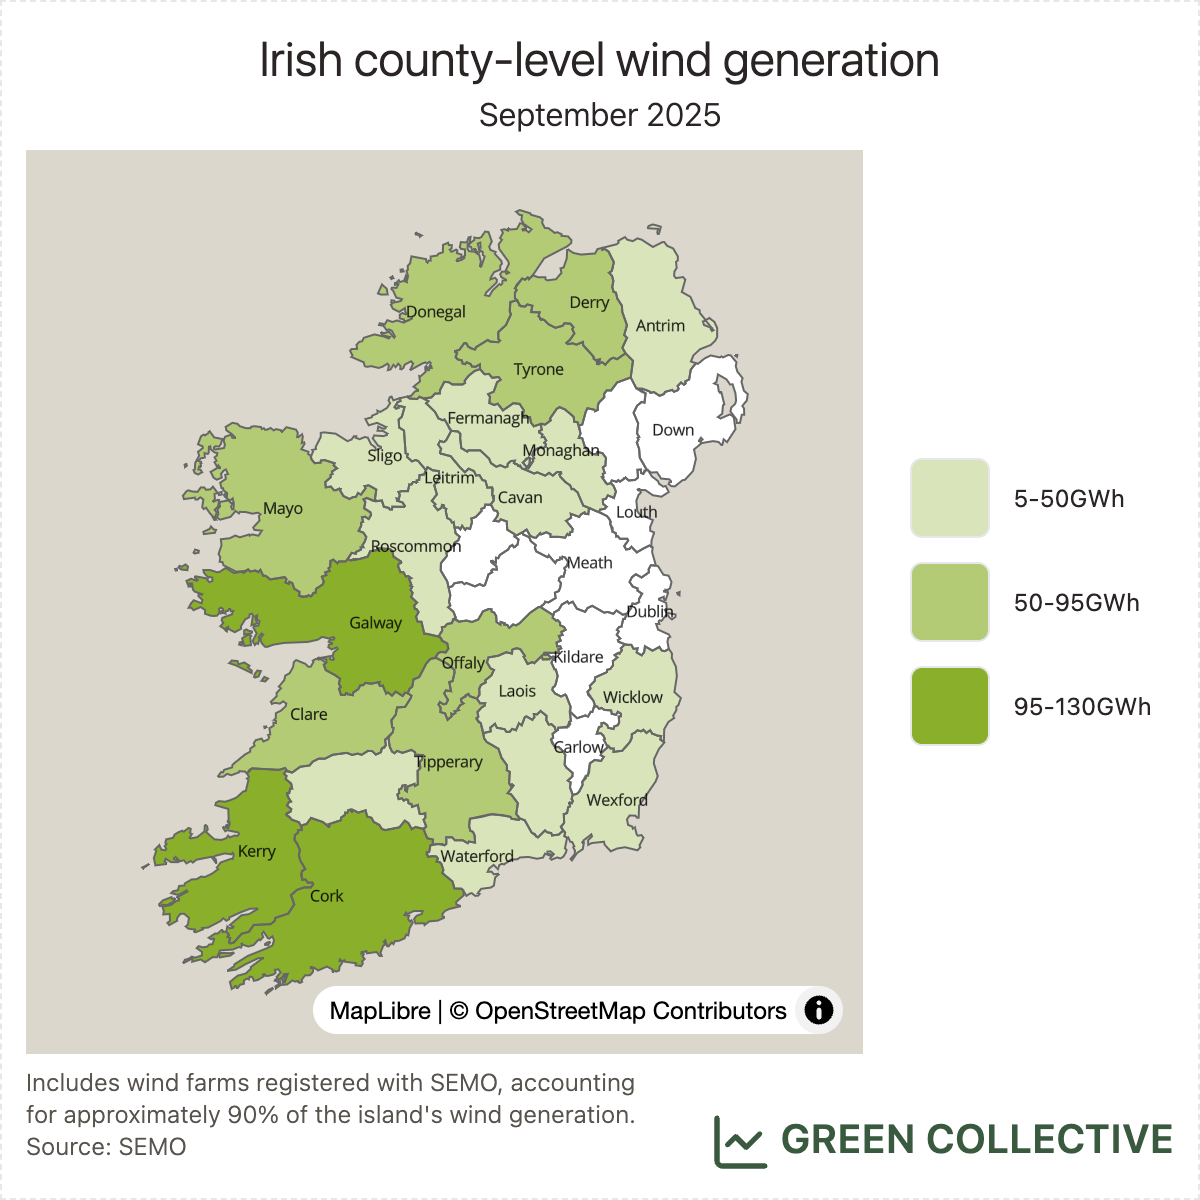
The top wind-producing counties during September 2025:
- Kerry (130.3GWh)
- Cork (120.5GWh)
- Galway (95.5GWh)
- Derry (76.8GWh)
- Mayo (73.2GWh)
Kerry held onto top spot again during September after having been briefly dethroned by Cork during July. Galway and Mayo are also regulars in the top 5, although this month we note that Mayo's total is, for the second month in a row, significantly behind Galway's. For the second month in a row – and for only the second time ever – Derry appears in the top 5, this month reaching #4. As noted above, Offaly's Yellow River Wind Farm has had a prolonged outage which, combined with Derry's new Corlacky Wind Farm (which during September started exporting its maximum capacity of approximately 45MW), has lately propelled Derry into the #5. However, with, as of the last few days of September, Yellow River's roughly 100MW slowly ramping up again, this may well change in October.
Solar
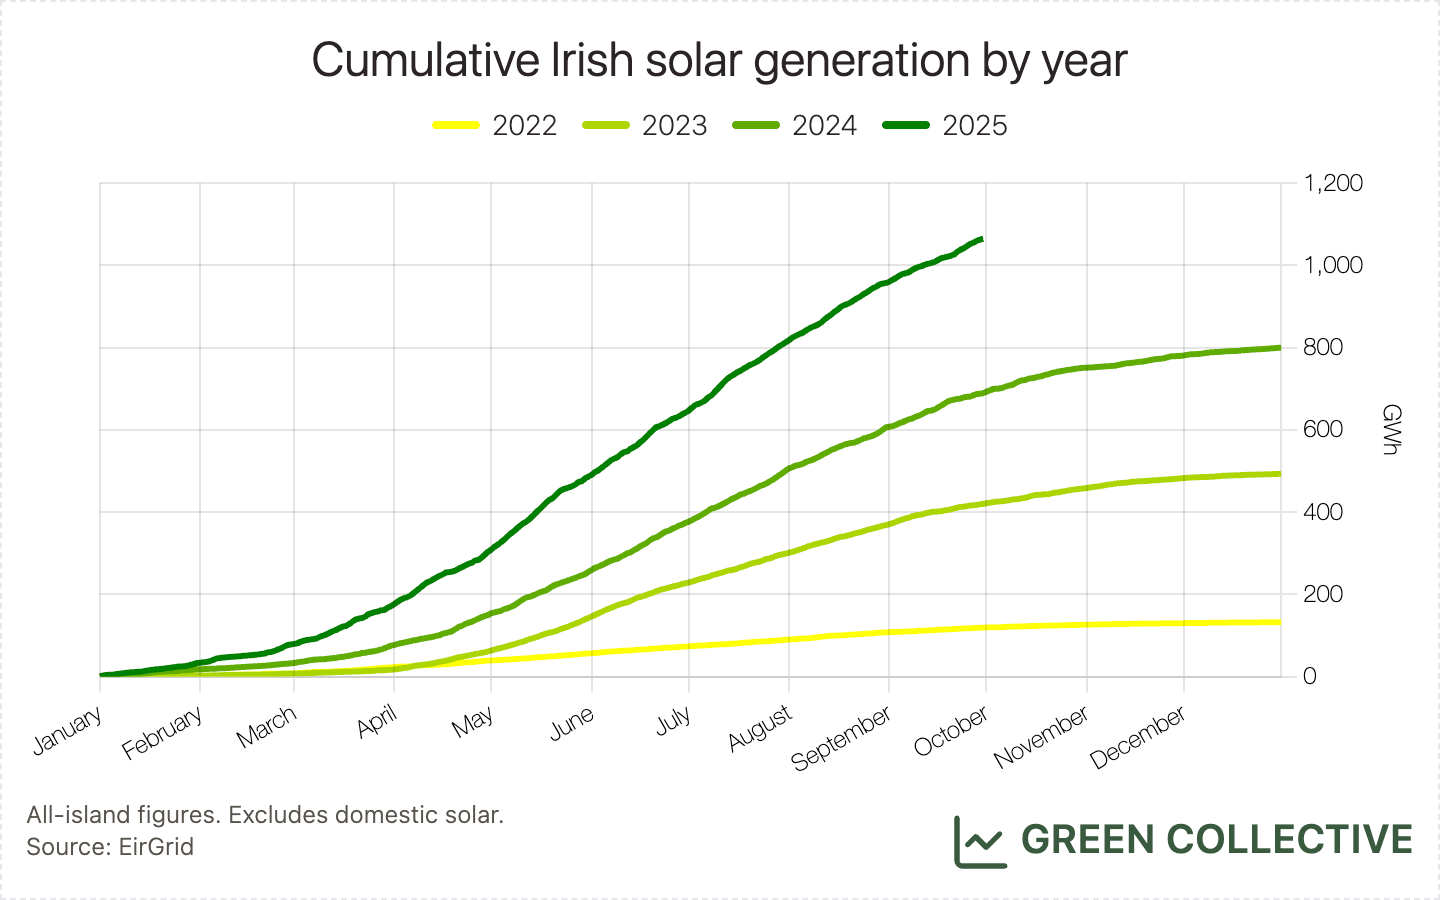
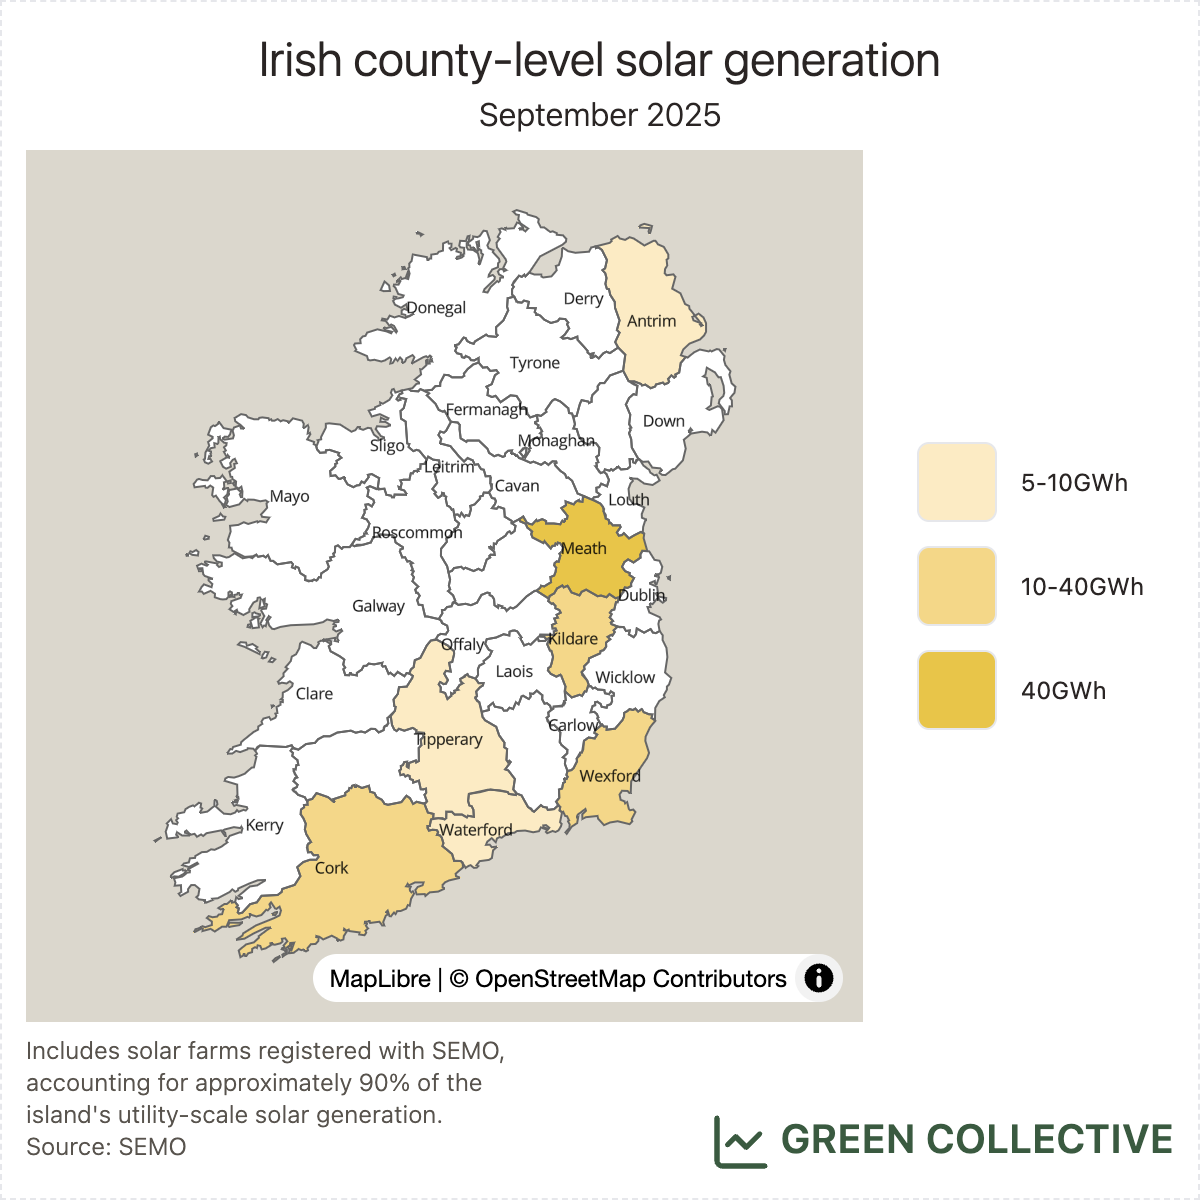
107.3GWh of solar generation was equivalent to 3.3% of all-island electricity demand. This was the most solar generation and its highest share of demand yet seen in a September month, beating September 2024's 83.2GWh / 2.6%.
On September 8, all-island solar production for 2025 exceeded 1TWh. This is the first time Ireland has seen 1TWh+ in a single year. Eyeballing the cumulative chart below, it looks like 2025 will finish with approximately 1.2TWh; this would represent a roughly 50% year-on-year increase from 2024.
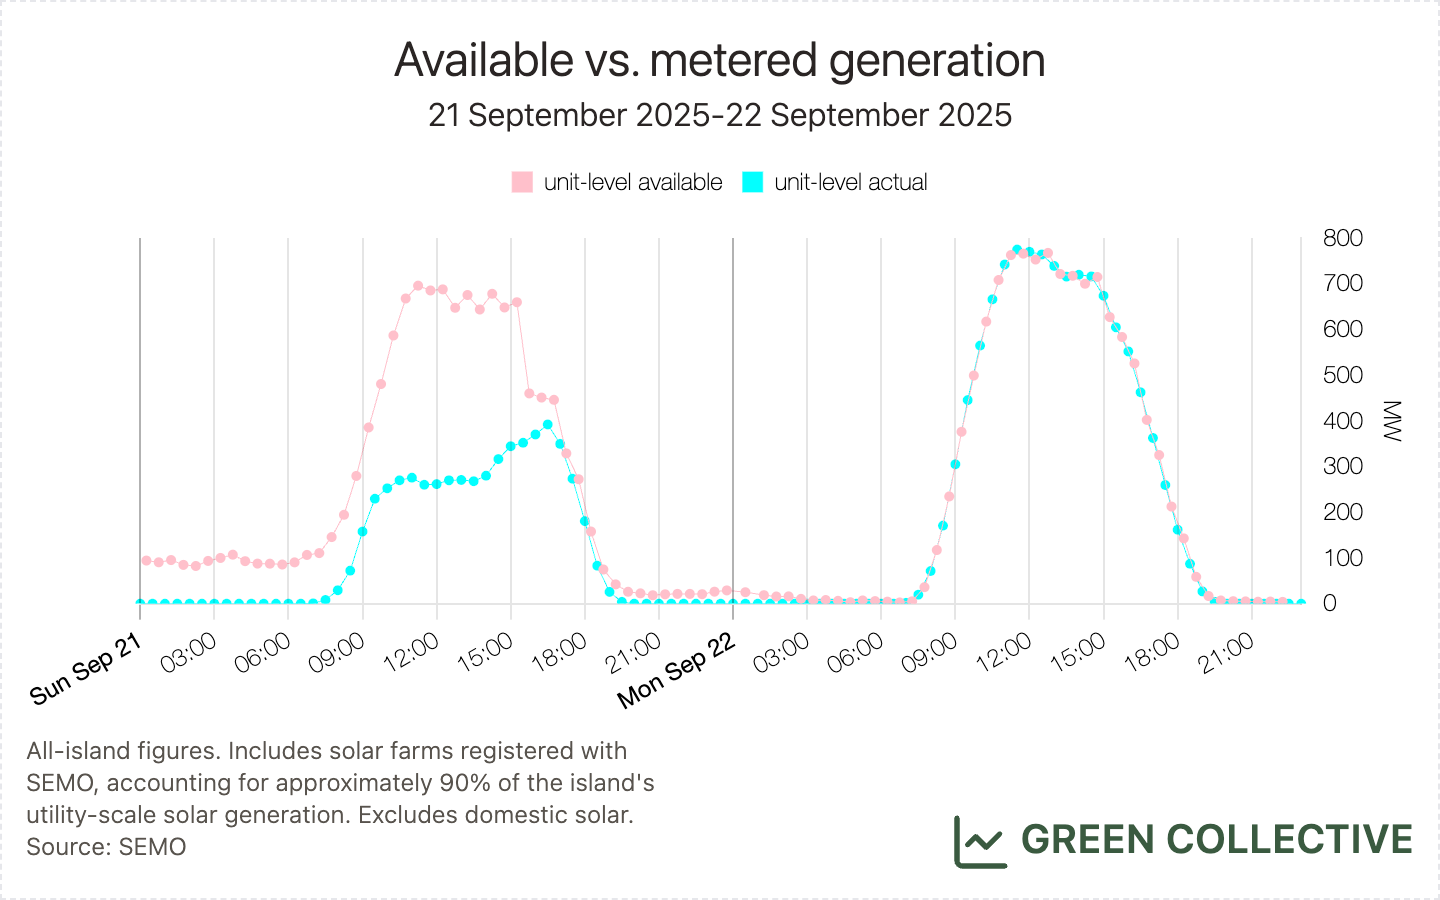
On Monday, September 22, solar output on the Irish grid reached a new high of 934MW. This was equivalent to approximately 19% of all-island electricity demand at the time. This initially took us by surprise because the most recent record occurred back in July and we figured solar had peaked for this year; however, perhaps we should read our own newsletter more closely: back in March we wrote:
...it's clear now that the "solar record season" runs roughly March-September and is steadily expanding.
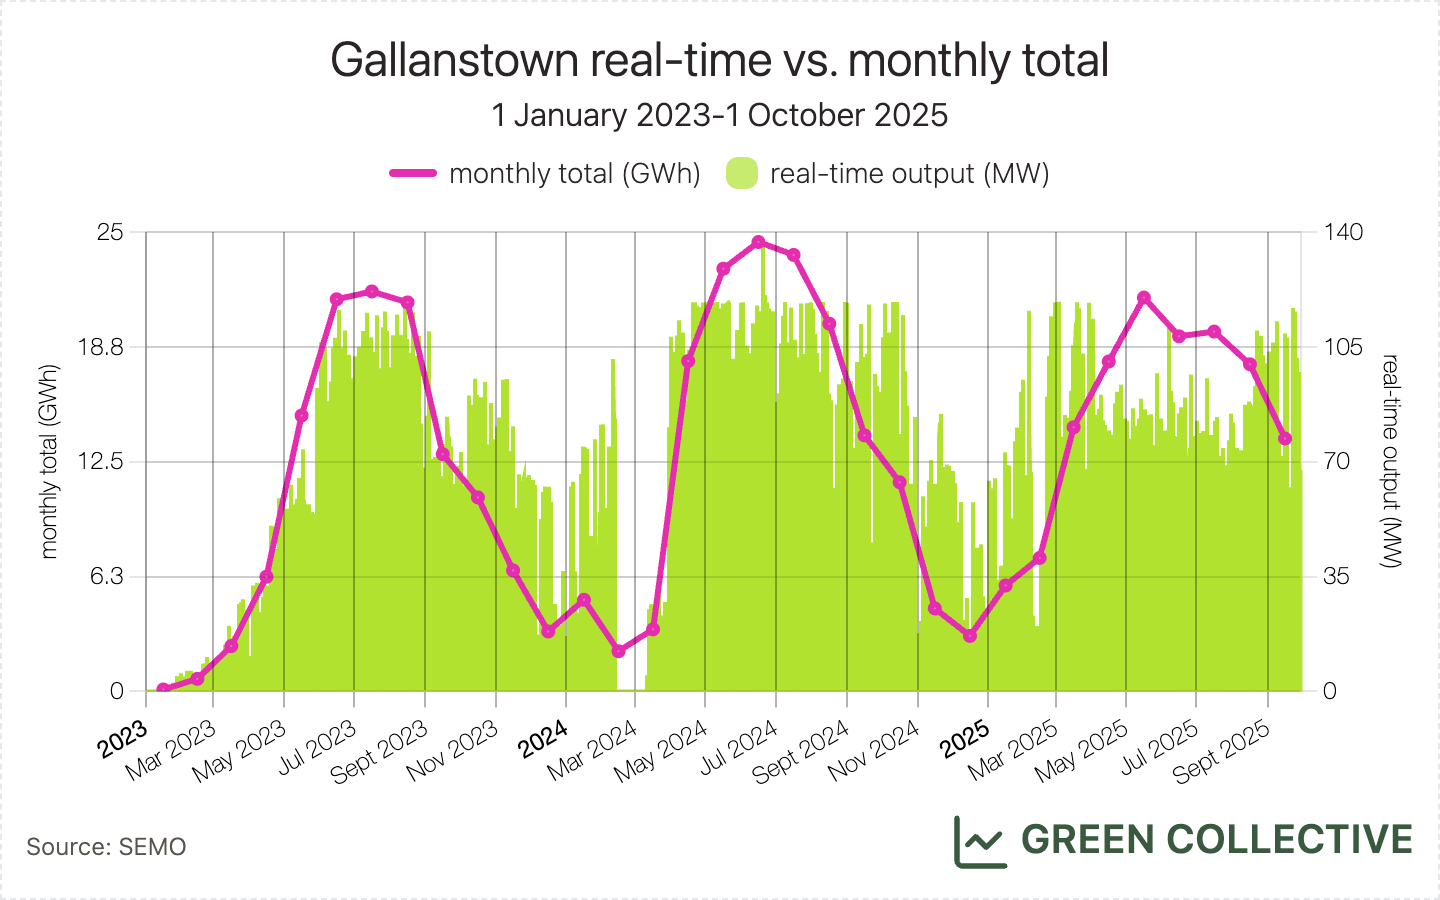
That said, it's still striking that we didn't see any solar records during August. Why not? As noted several times in this newsletter this year, some of the island's largest solar farms have not been producing as much power as they did during the summer of 2024. Gallanstown, for example, has been peaking at approximately 80MW for most of the summer – well below the 120MW it regularly reached last year. However, in recent weeks, we have finally seen both it and nearby Gillinstown reaching full capacity.
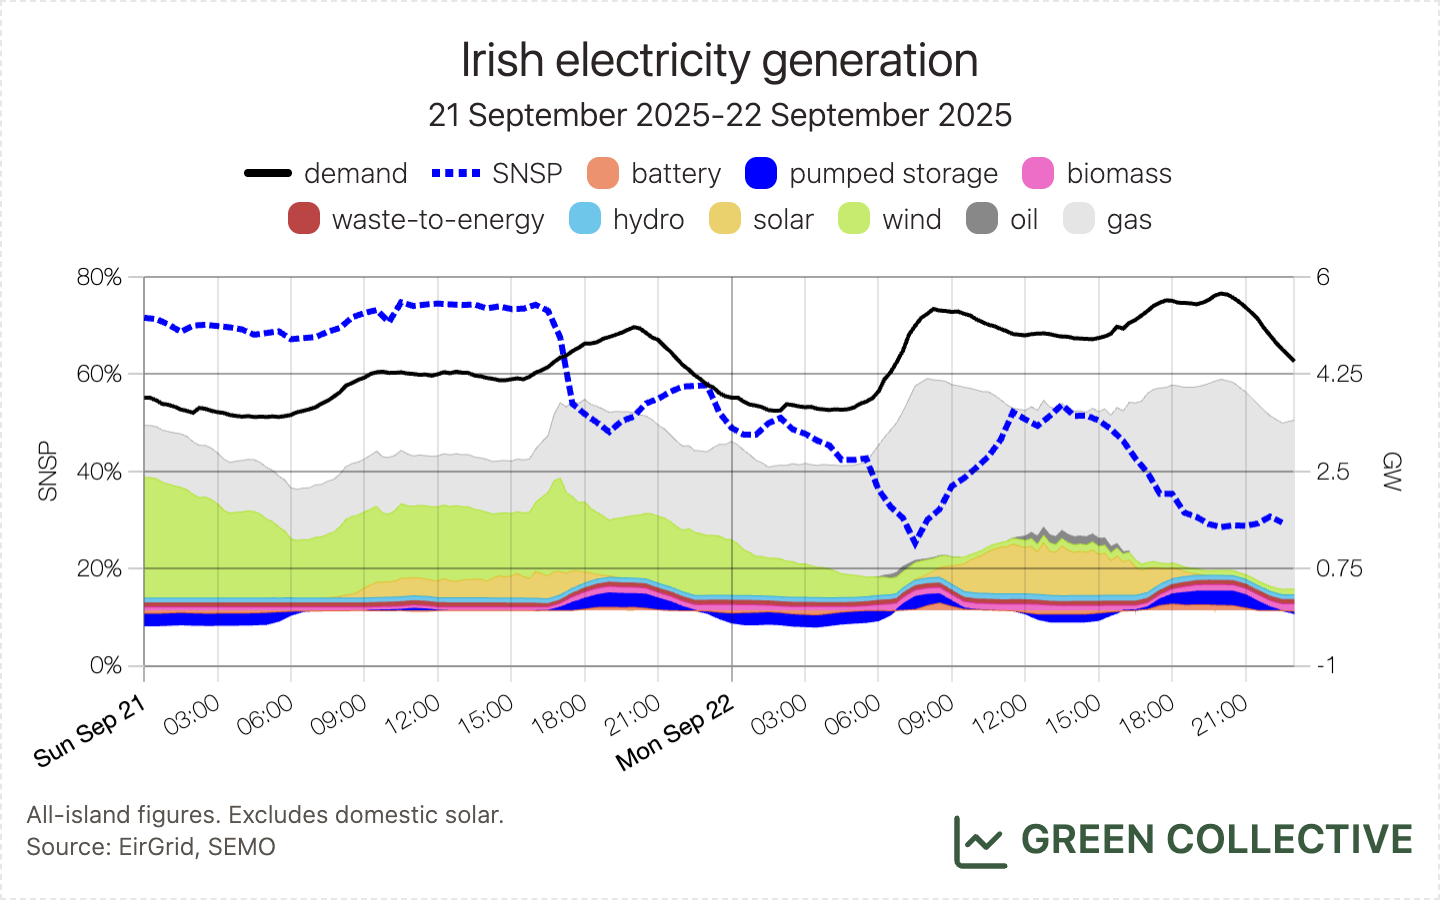
Additionally, there seems to have been virtually no dispatch down for solar on the day this record occurred. It's worth comparing the day the record occurred (Monday 22nd) with the day immediately prior: on Sunday 21st, winds and imports were much higher, pushing SNSP to its current 75% limit and apparently ousting solar from the grid. Though available solar is comparable on both days, on Monday 22nd both wind and imports are much lower and solar appears to have no competition.
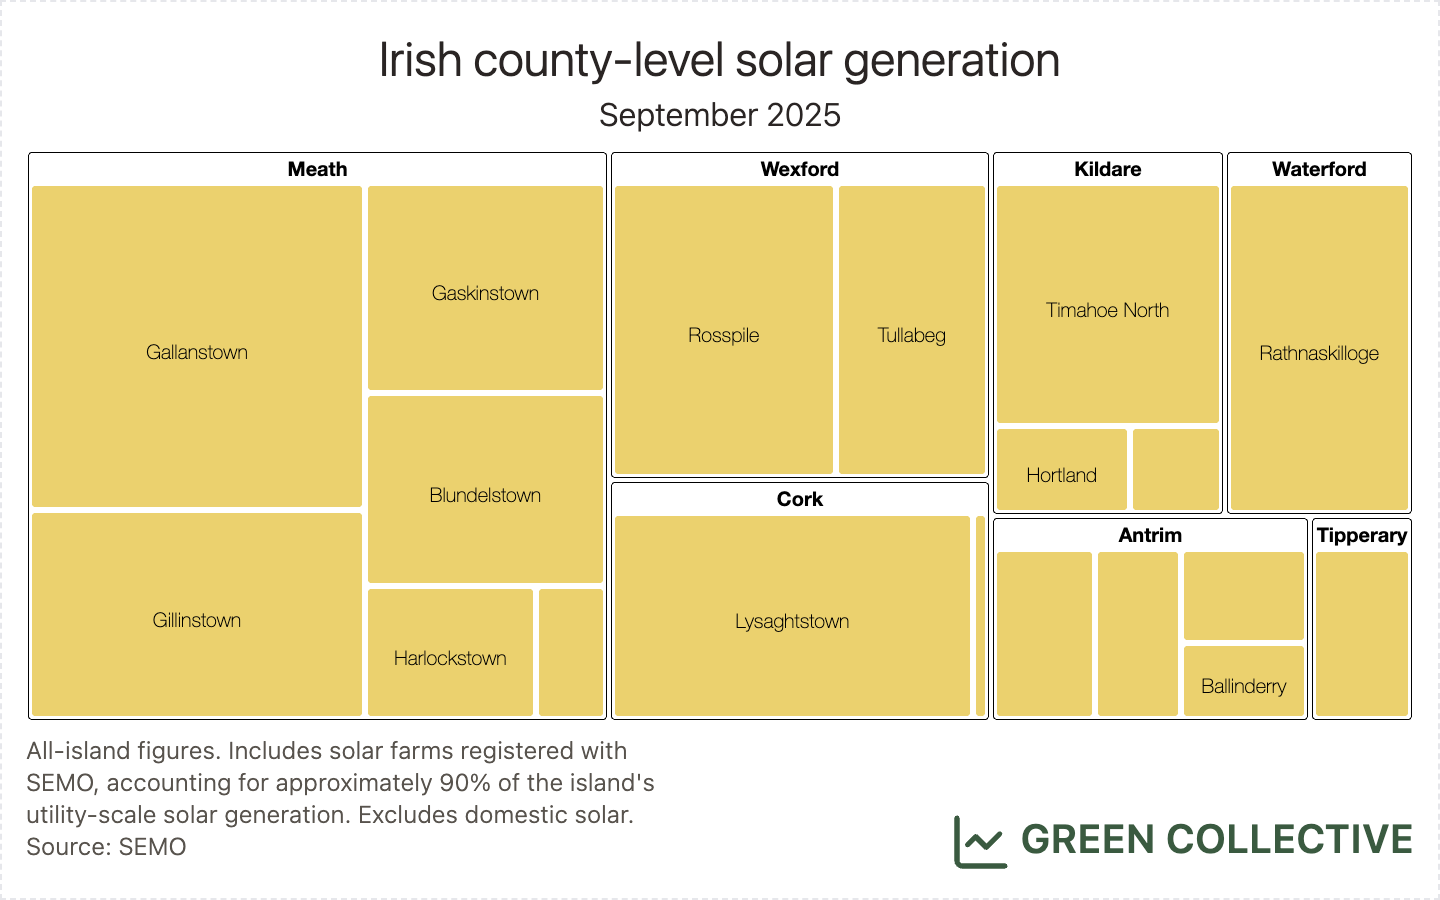
The top solar-producing counties during September 2025:
- Meath (39.6GWh)
- Wexford (15GWh)
- Cork (10.9GWh)
Meath remains the clear leader in Irish solar with at least 1/3 of production taking place there. Wexford maintains its long-term streak as distant #2. In September, Cork was back to #3, having been ousted in August by Kildare. Cork's Lysaghtstown was back at full strength this month and, as the second-highest producing solar farm on the island, it's more than enough to compensate for Kildare's new Dunmurry Springs PV which we're happy to report that in only its second full month of production has been reaching its maximum capacity of approximately 12MW.
Storage
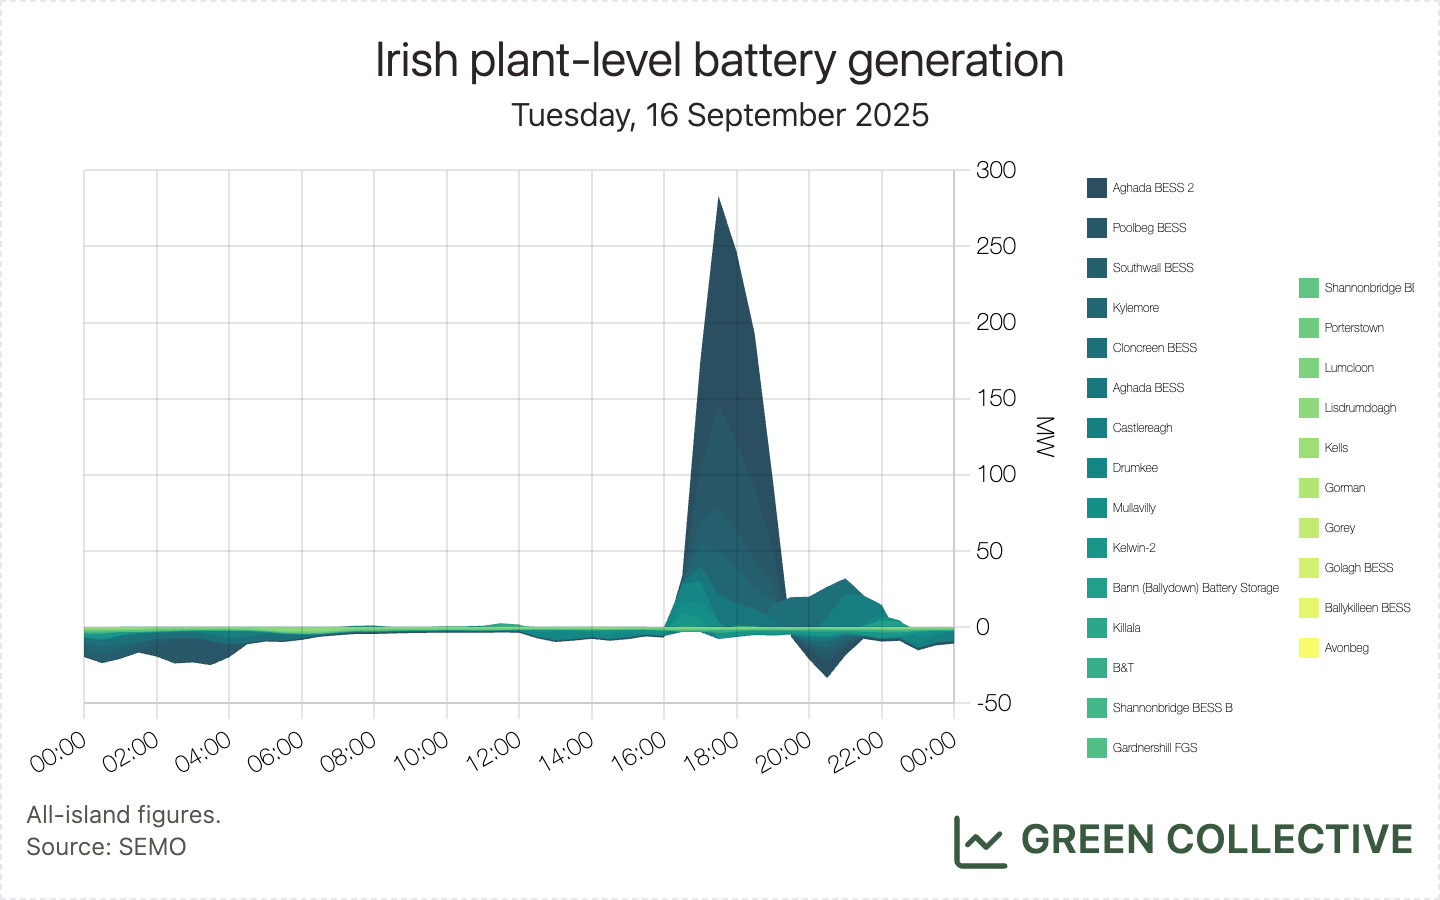
5.9GWh of discharging battery was by far the highest yet for a September month, at almost 4x that of September 2024's 1.5GWh. This was also significantly up on August's surprisingly low figure of 4.4GWh. On batteries' highest days, this was equivalent to approximately 5% of all-island demand; add Turlough Hill to the mix and storage was at at least one point during the month equivalent to just over 10% of all-island demand (the current all-time record is 11.5%, set on May 11 of this year).
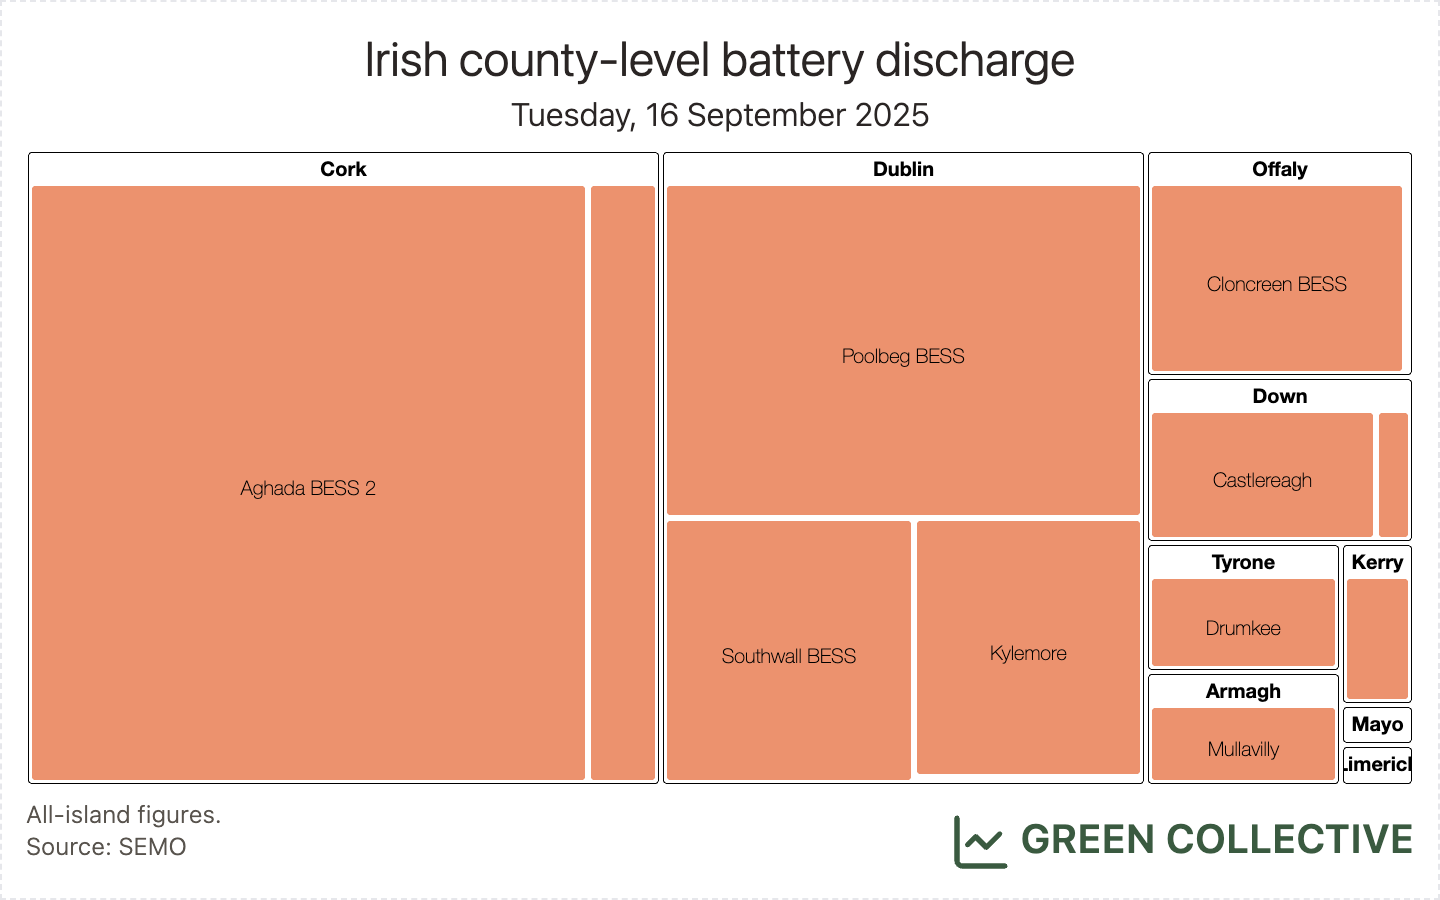
On Tuesday, September 16, battery discharge on the Irish grid reached a new all-time high of 275MW, finally beating the previous record of 266MW set all the way back in January. Together with Turlough Hill, storage discharge was equivalent to approximately 9% of all-island electricity demand at that time. Cork's pair of Aghada plants were key here, accounting for about half of discharge, and Dublin's duo of Poolbeg and Southwall along with Kylemore accounting for most of the other half.
Other Renewables
- Hydro generation, totalling 51.8GWh, has started approaching winter levels again, after one of the worst months on record in August.
- As noted last month, Edenderry has usually had quite long outages in the late summer to early autumn. However, that seems to have changed this year and so, similar to what we noted here last month, September 2025 was the first September month with "full" biomass generation, totalling 52.5GWh.
Carbon Emissions
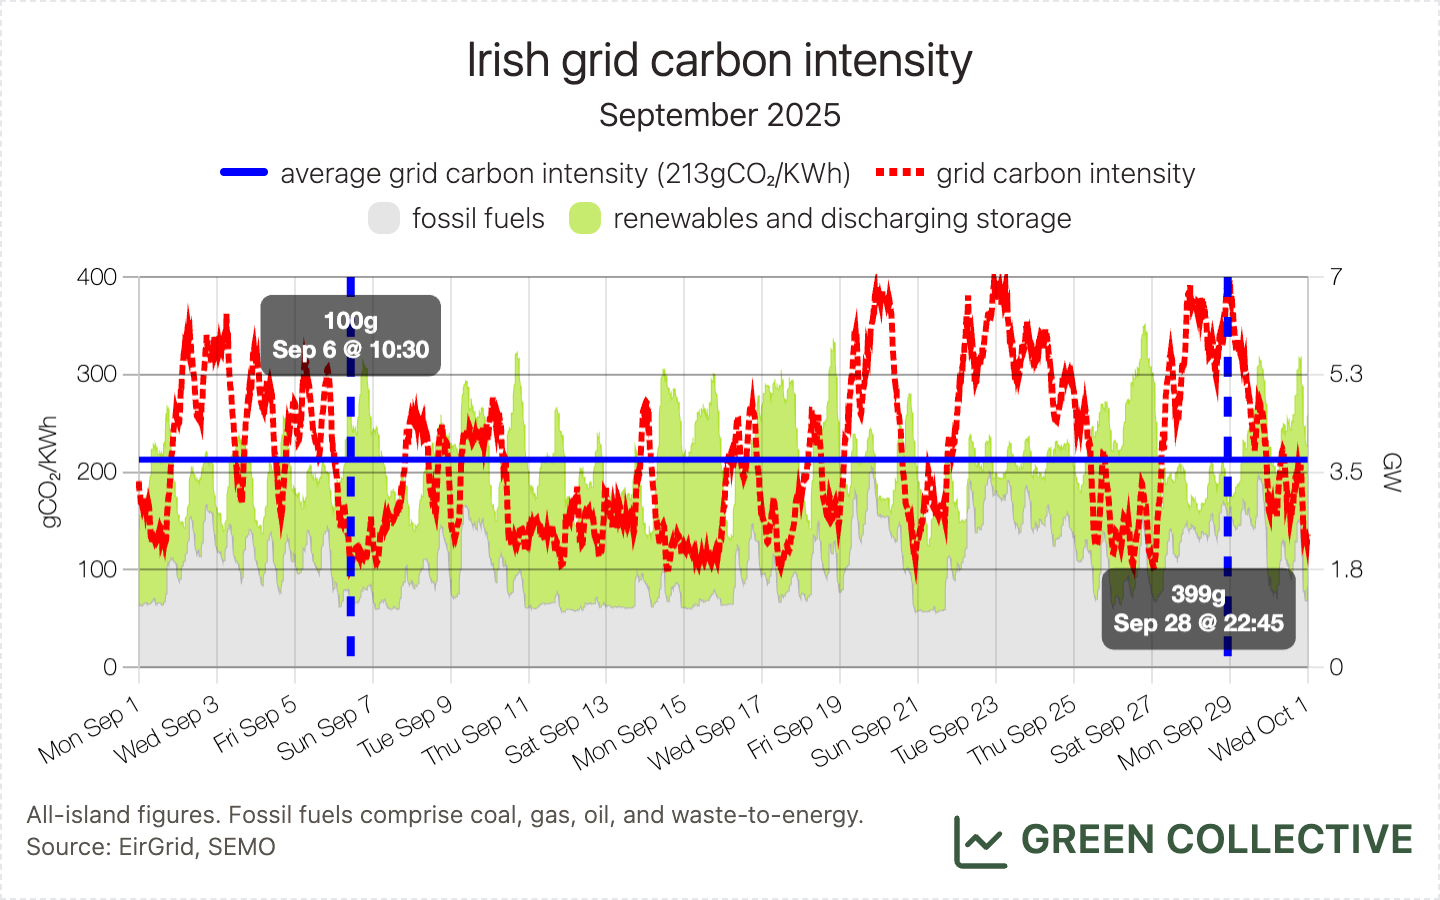
We estimate that during September 2025 the Irish grid emitted approximately 575,000 tonnes of CO₂, emitting for each kWh of electricity generated between 100g and 399g of CO₂ for an average grid carbon intensity of 213gCO₂/KWh.
This was the lowest amount of carbon ever emitted by the Irish grid in one month, just beating June's 595,000 tonnes. 2025 is the first year we've seen carbon emissions dip below 600,000 tonnes in one month and it's now happened three times in three different seasons: February, June, and September.
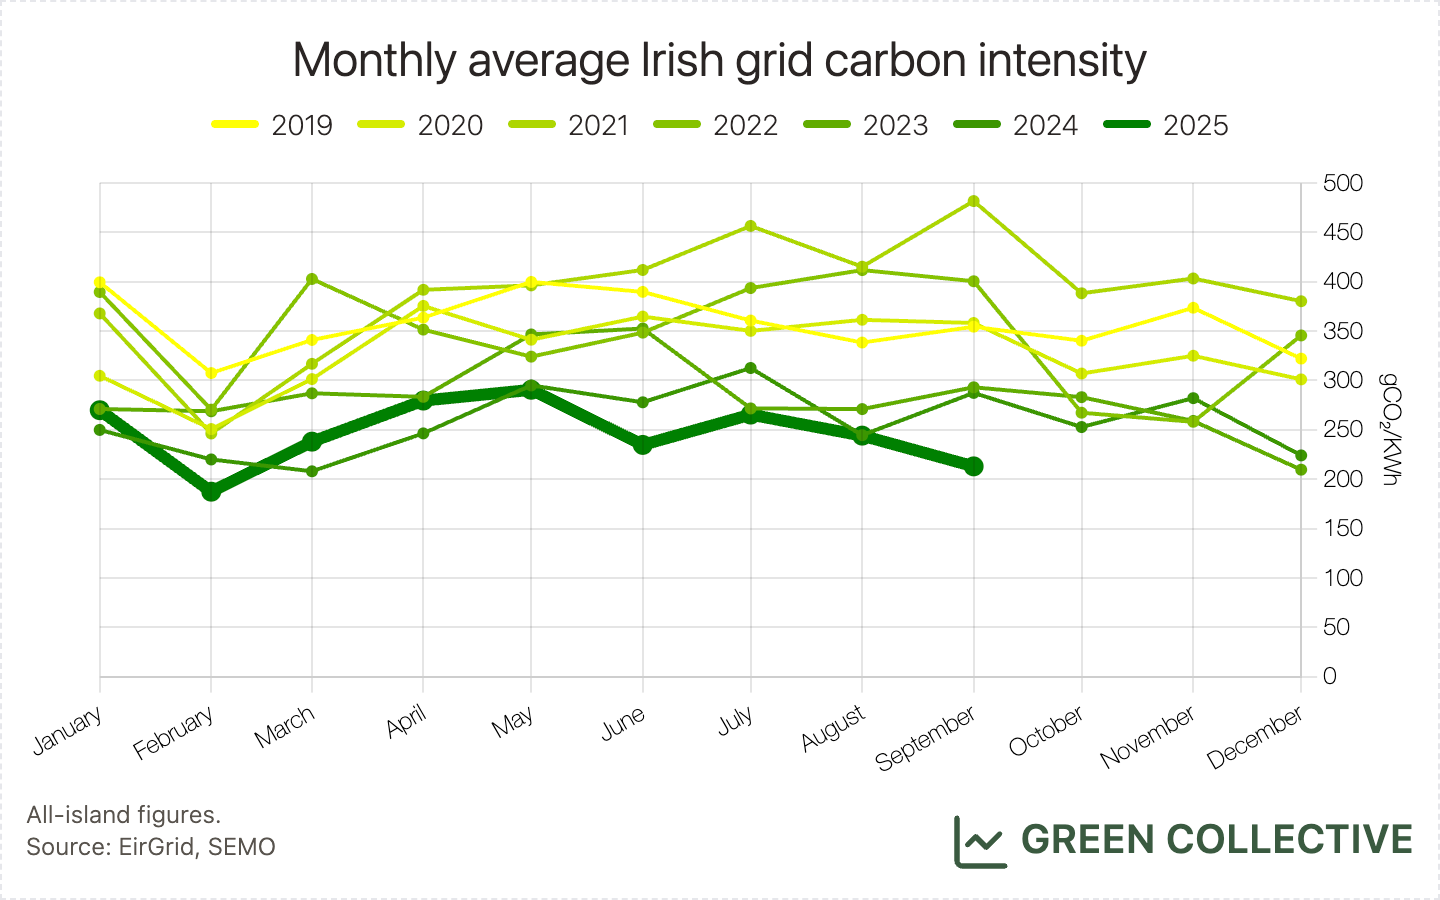
This was the second-lowest monthly average grid carbon intensity this year, behind only February's all-time low of 187gCO₂/KWh, and the fourth-lowest yet seen.
In terms of individual days, we saw some of the lowest ever amounts of fossil fuels burned in a September day, with September 12 totalling just 26.4GWh, equivalent to 24.4% of all-island demand. For comparison, the all-time low is 23.9GWh, seen Christmas Eve 2023. However, with coal now eliminated and oil severely constrained, September 12 2025's emissions were significantly lower than Christmas Eve 2023, totalling just 11,500 tonnes: only 4 other days have seen less.
Lastly, it's important to note that while the shift in fossil fuel generation to gas is undoubtedly a factor, even more key is a general shift on the grid to imports since 2023 which has greatly accelerated in 2025 thanks to the addition of the Greenlink interconnector. We have talked about this extensively in our newsletter this year, notably in our February report.
Hatches & Dispatches
- Monroe East Solar in Tipperary with a capacity of 8MW appeared in SEMO's registered unit list on 24 September. This solar farm, awarded capacity in RESS 1 in 2020 and re-entered auctions in RESS 4 in 2024, eventually came online in 2025. It's one of seven solar projects that have been awarded capacity in two separate RESS auctions, as discussed above in this month's introduction.