This article was first sent to our newsletter subscribers. To receive our monthly reports on the 1st of each month, subscribe now for free.
August has been an exciting month for us: Green Collective turned five! Irish Energy Bot (RIP) sent out its first tweet five years ago. We made a flythrough of our charts through the years (warning: this video may cause dizziness) to commemorate the occasion.
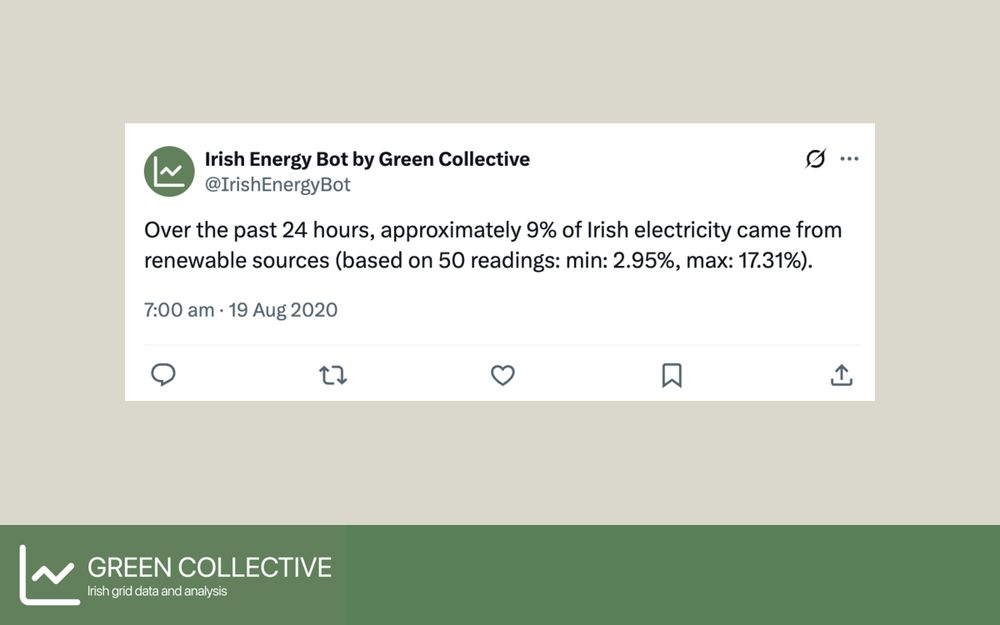
Seeing the screenshot of the first text-only (!) tweet from 19 August 2020 again felt a bit surreal, especially after having our data cited in the Financial Times for the first time earlier in August. We contributed hourly generation data of the Republic of Ireland to an article entitled "Inside the AI race: can data centres ever truly be green?". It was a pleasure seeing our data being turned into fantastic charts and graphs by the FT's visual and data journalism team.
To be honest, we were surprised when the FT reached out to us about Irish data, as we have had almost no success over the past few years getting major publications in Ireland interested in our data and trends. And it's not for the lack of trying. Then again, as recent as last month, coverage of renewable energy in Ireland on national publications looks like this and this, where it often reads like re-prints of press releases with no added context or analysis. We will keep doing what we do here and hopefully we will have the opportunity someday to contribute data to the major papers' nuanced energy coverage.
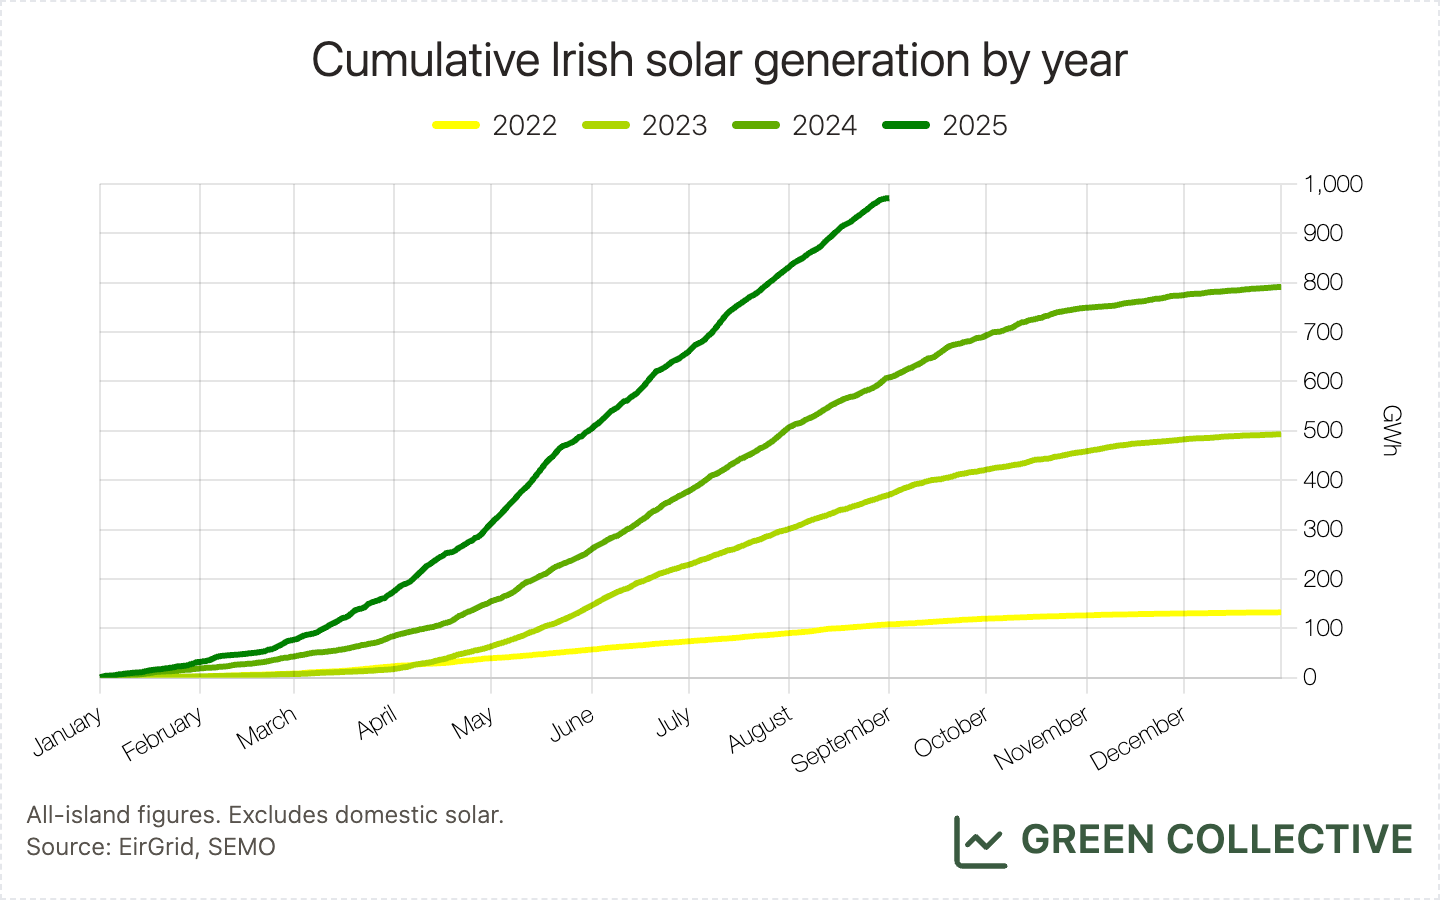
To conclude this longer-than-usual introduction on a positive note, we were inspired by this chart from an FT article tracking the growth of solar in Britain (it feels like we need to clarify at this point that Green Collective is not an FT fan account) and we created a version for solar in Ireland below: by July, solar generation in 2025 surpassed the total of 2024; total solar generation is well on its way to pass the 1TWh mark in 2025!
Summary
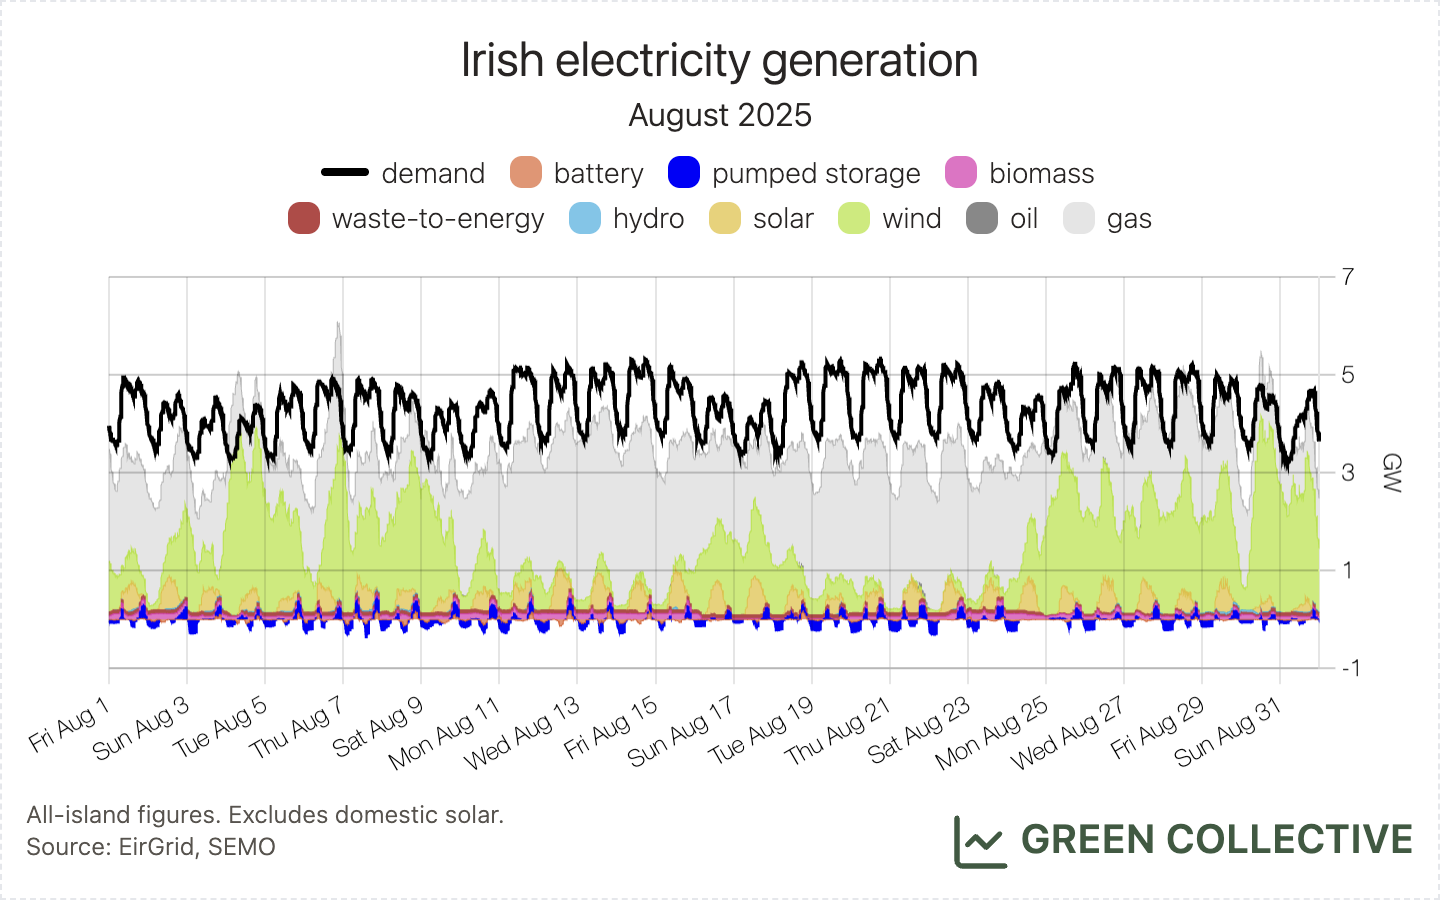
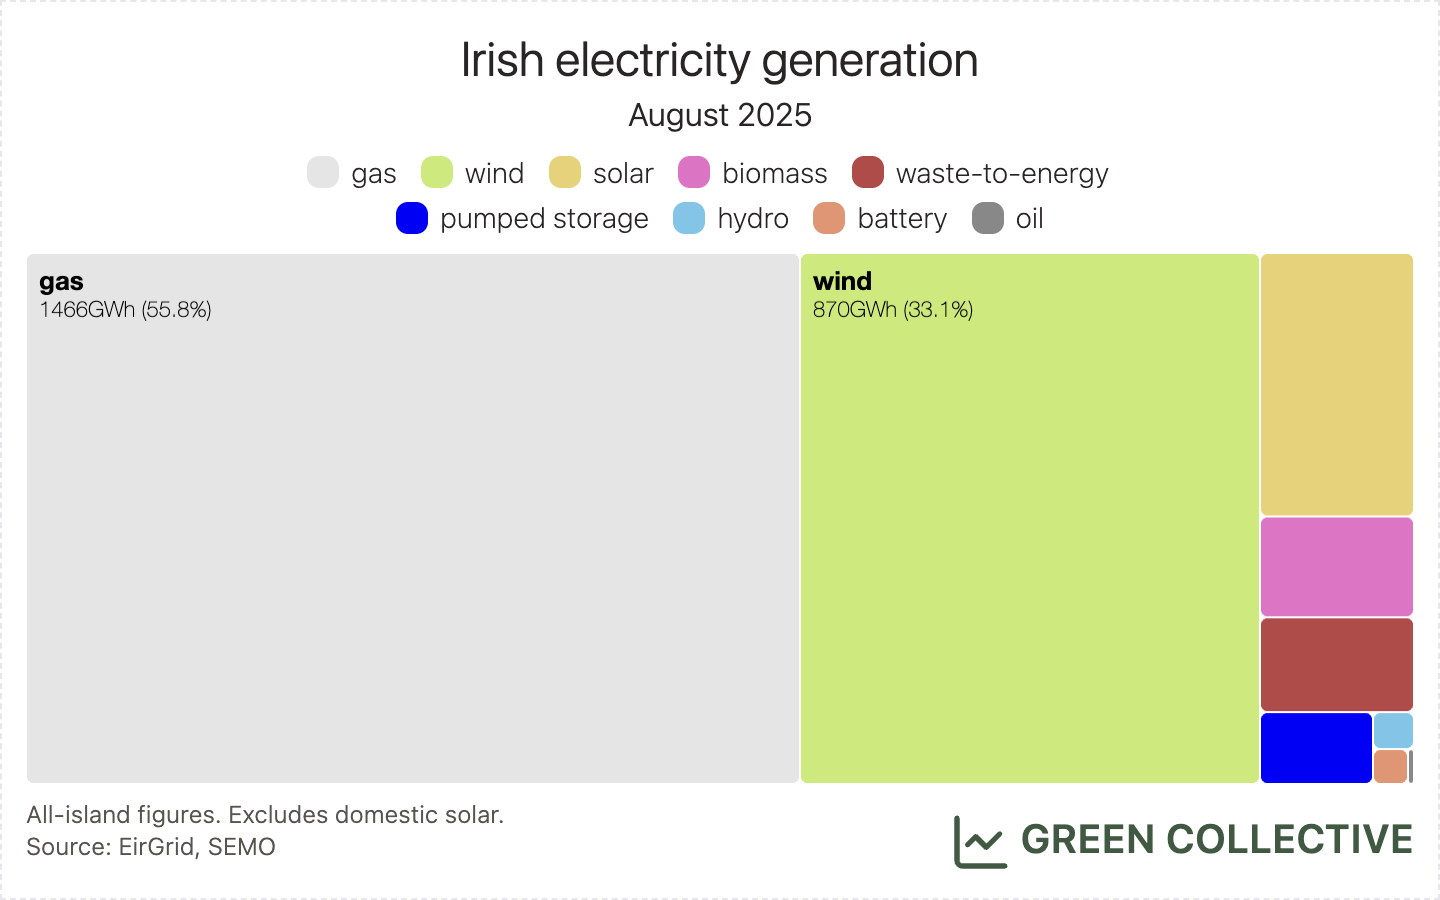
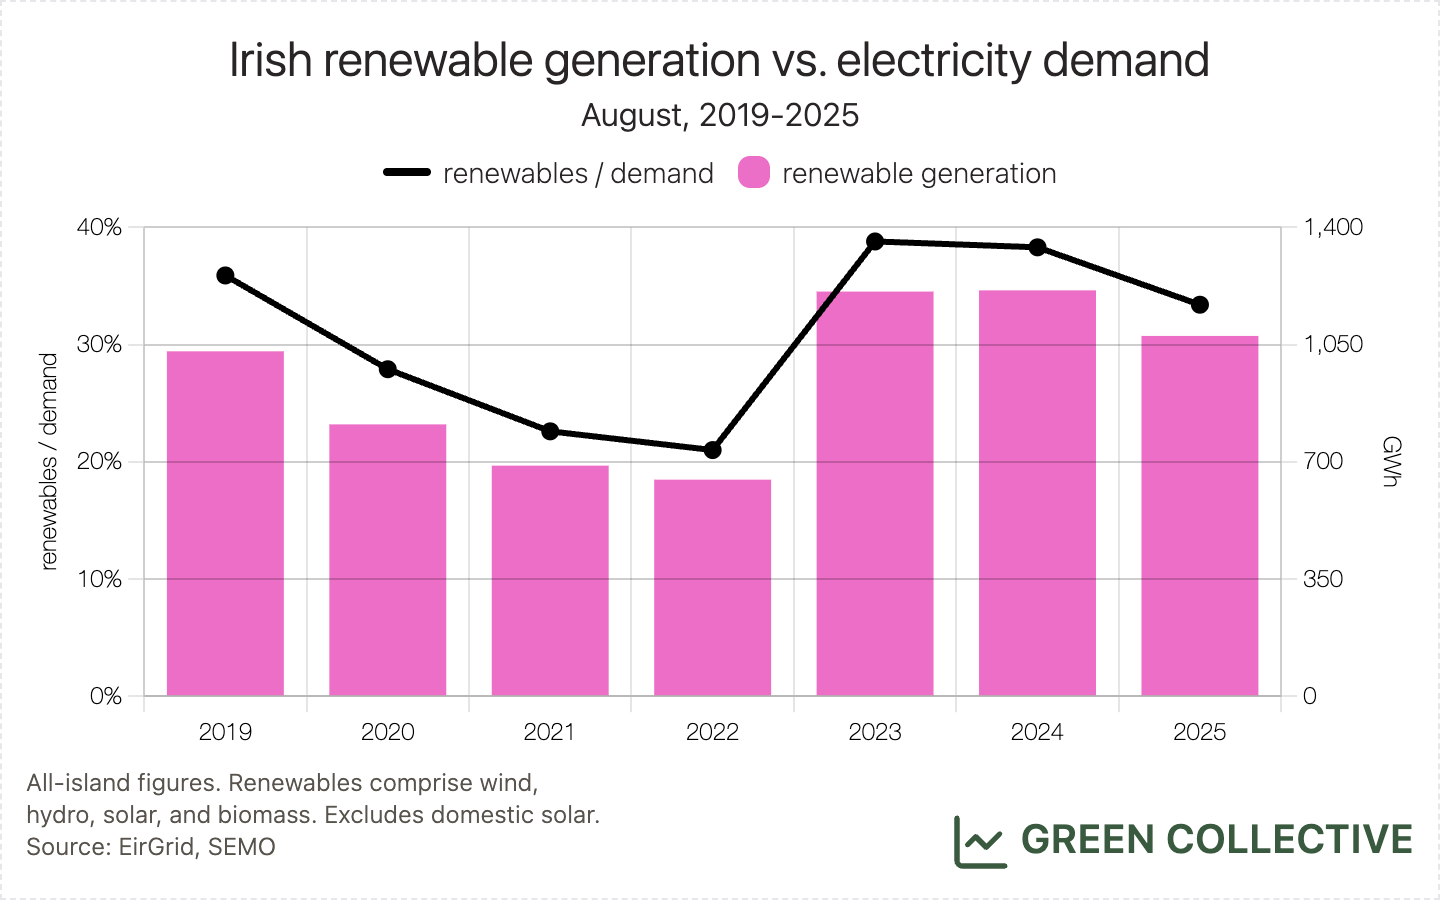
Renewable generation was equivalent to 33.4% of all-island electricity demand, fossil fuels 47%, and imports 19.7%. This was about normal for renewables in an August month: lower than the 38-39% seen in August 2023 and August 2024 but much improved from what we saw in August months between 2020 and 2022.
The full breakdown of the percentage of demand covered by each source:
- renewables:
- wind: 27%
- solar: 4.5%
- biomass: 1.7%
- hydro: 0.2%
- fossil fuels:
- gas: 45.4%
- waste-to-energy: 1.6%
- oil: <0.1%
- storage:
- pumped storage: 0.9%
- batteries: 0.1%
- imports: 19.7%
It's worth calling out the strong winds of Storm Floris which combined with lower seasonal demand to produce the first "80% day" we've seen for renewables since February of this year, and the first ever during a "summer" month. We reference the various highs and lows of Storm Floris throughout this report.
Wind
870.2GWh of wind generation was equivalent to 27% of all-island electricity demand. This was down from August 2023 and August 2024 which each totalled just over 1TWh, equivalent in both years to approximately 33% of August all-island electricity demand.
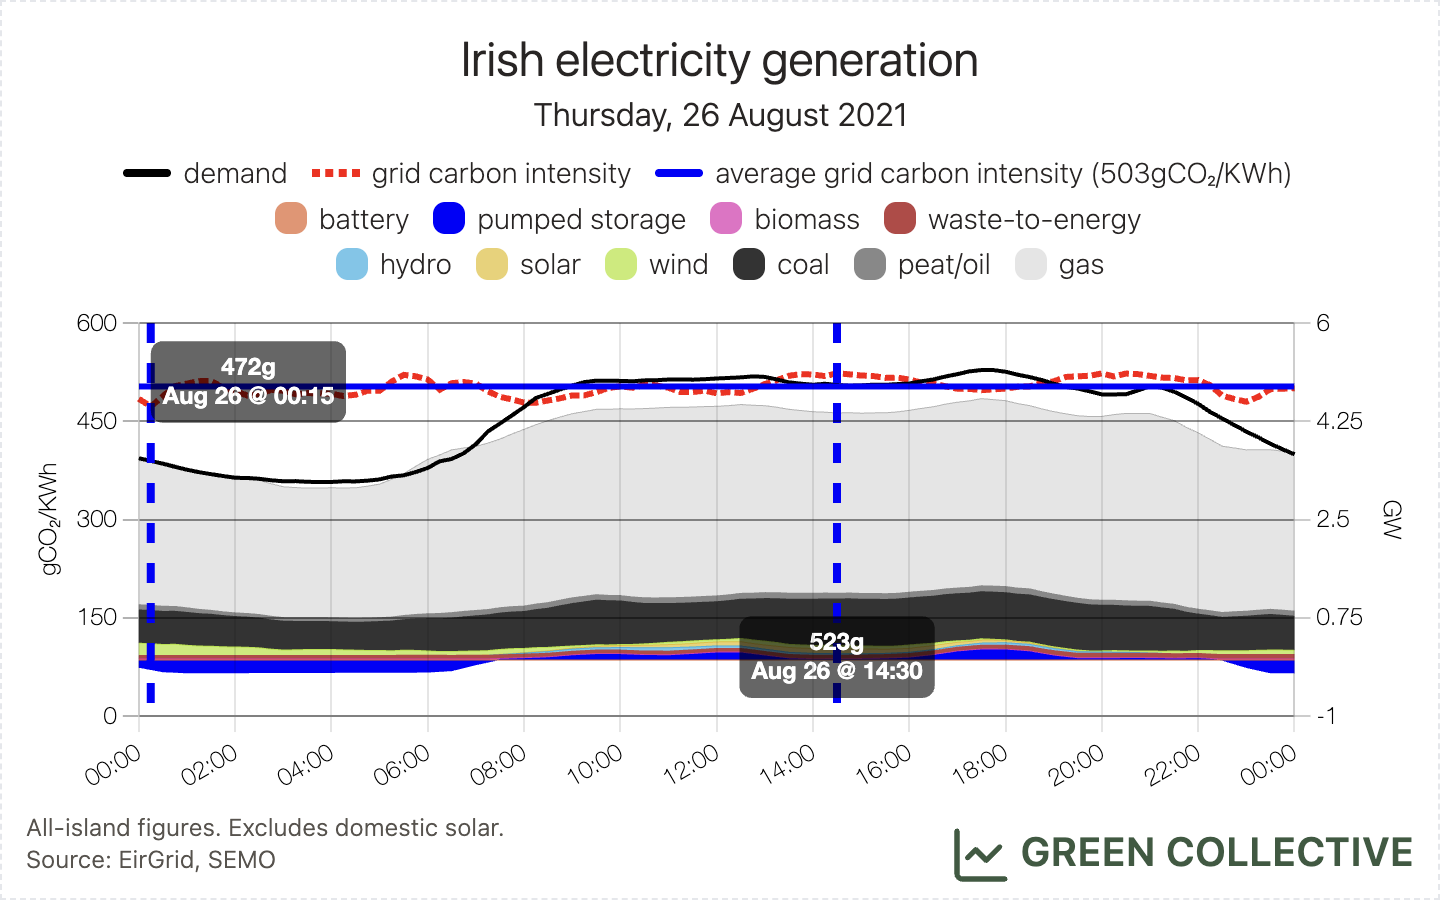
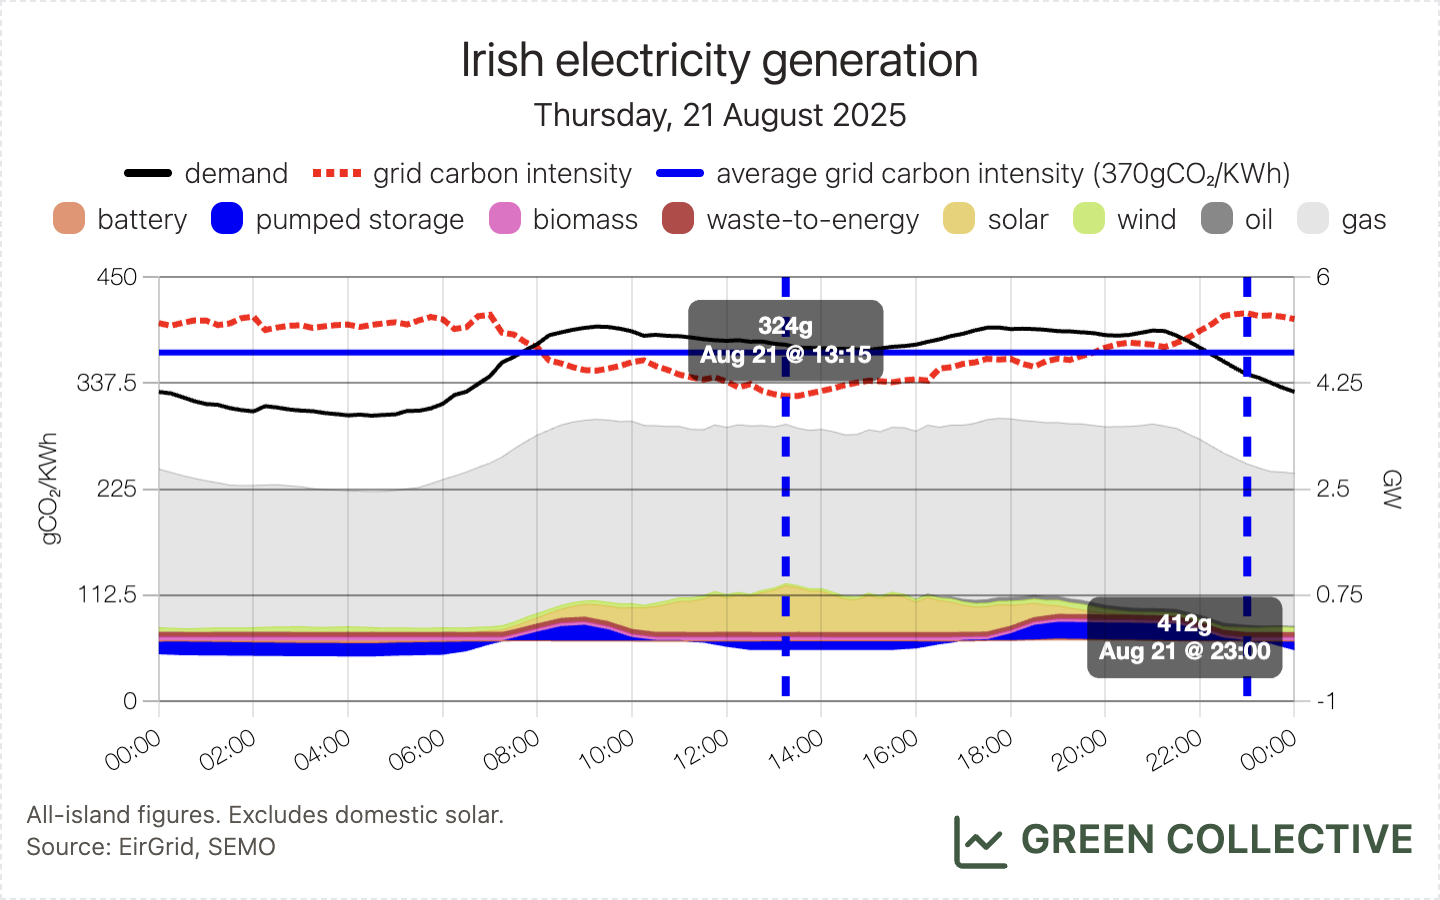
There was a long stretch of low winds (roughly August 10-23, inclusive). This isn't unusual for August which is over-represented in a list of "lowest wind days" in recent years. We compared the lowest day in August 2025 with a similar day – in terms of demand and wind generation – from August 2021 and it's heartening to see how the dirtier fossil fuels have been displaced by both solar and imports to reduce carbon emissions on such days by an impressive 40%.
And, there were a few notable highs for wind this month:
- Wind generation briefly exceeded 100% of all-island electricity demand on the morning of Monday, August 4, during Storm Floris. This last occurred during February and has only occurred on one other previous occasion. This was the first time wind has ever exceeded demand during a "summer" month.
- On the same day, wind power equalled 74% of all-island electricity demand. This was the highest ever daily ratio for an August day.
- Wind output reached 3780MW on Saturday, August 30. This was the second-highest wind output yet seen in an August month, behind only August 2023's 3806MW. That small gap would easily have been covered by, say, the Yellow River wind farm which unfortunately is experiencing a prolonged outage. More on this below.

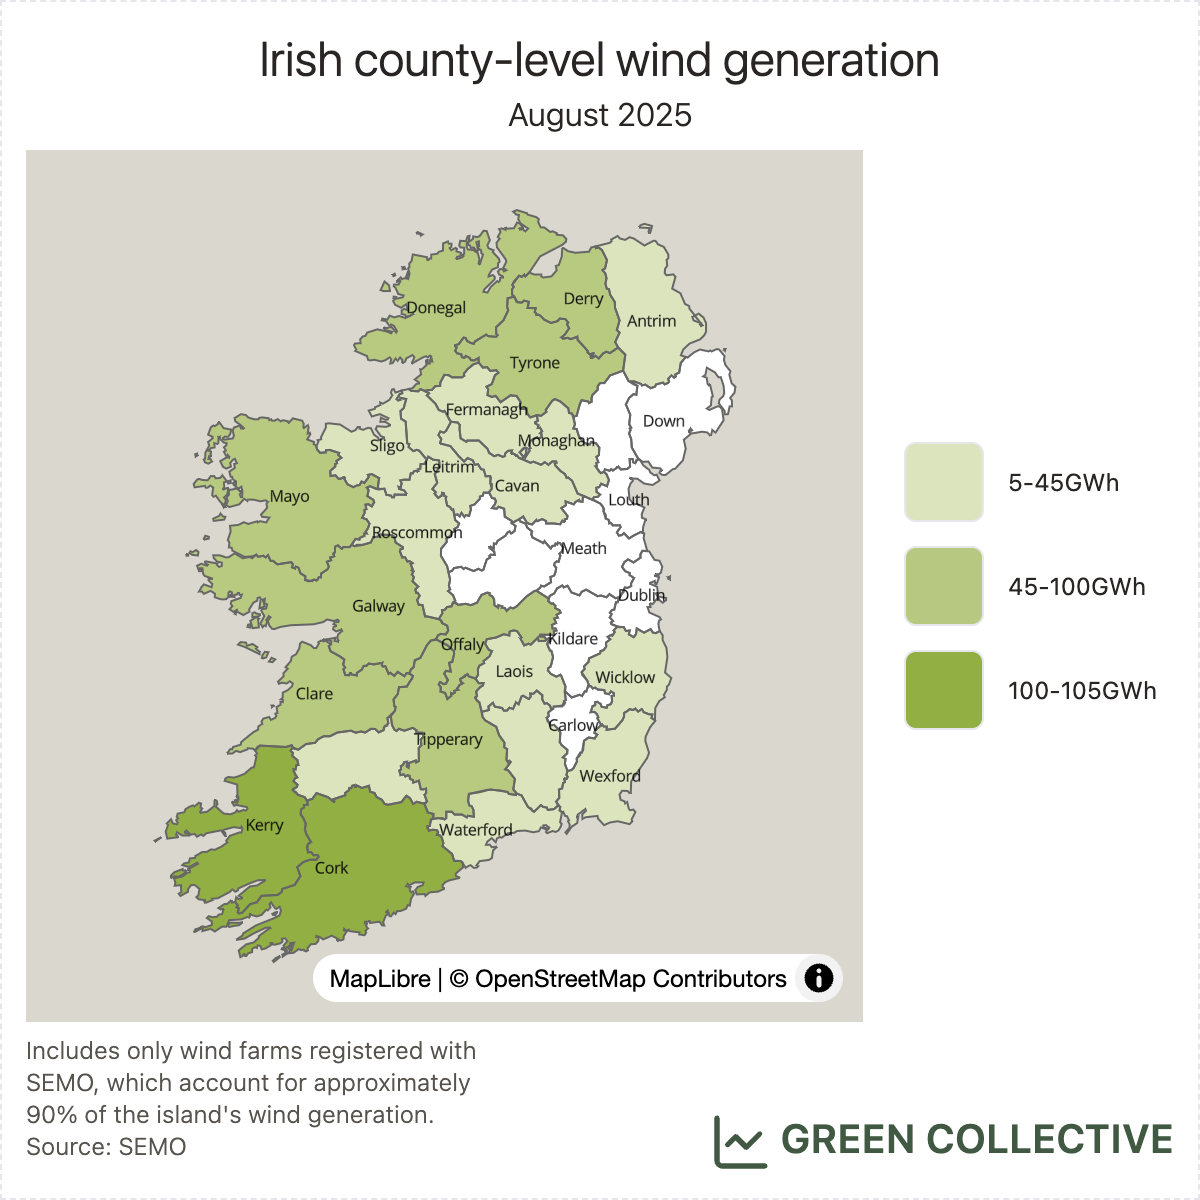
The top wind-producing counties during August 2025:
- Kerry (102.9GWh)
- Cork (97.6GWh)
- Galway (72.8GWh)
- Mayo (57.7GWh)
- Derry (54.4GWh)
Kerry reclaimed top spot this month, having been pipped by Cork in July. Galway and Mayo – homes to the two largest wind farms on the island – are regulars in the top five. Derry appears in the top five for the first time this year, ousting Offaly which has been a fixture of the top five since late 2024. We can attribute this to Offaly's Yellow River – normally a "top ten" wind farm – having been offline since mid-July (yes: Offaly placed #3 in July despite the absence of Yellow River for much of the month, something we missed in last month's newsletter).
Solar
144.2GWh from utility-scale solar farms during August 2025 represents ~50% year-on-year growth from August 2024 and was equivalent to 4.5% of all-island electricity demand. This makes it the 4th best month for solar yet, behind only the three previous months of summer 2025 (May-July). August places just ahead of April 2025, as might be expected given the handful of solar farms that have powered up over the summer.
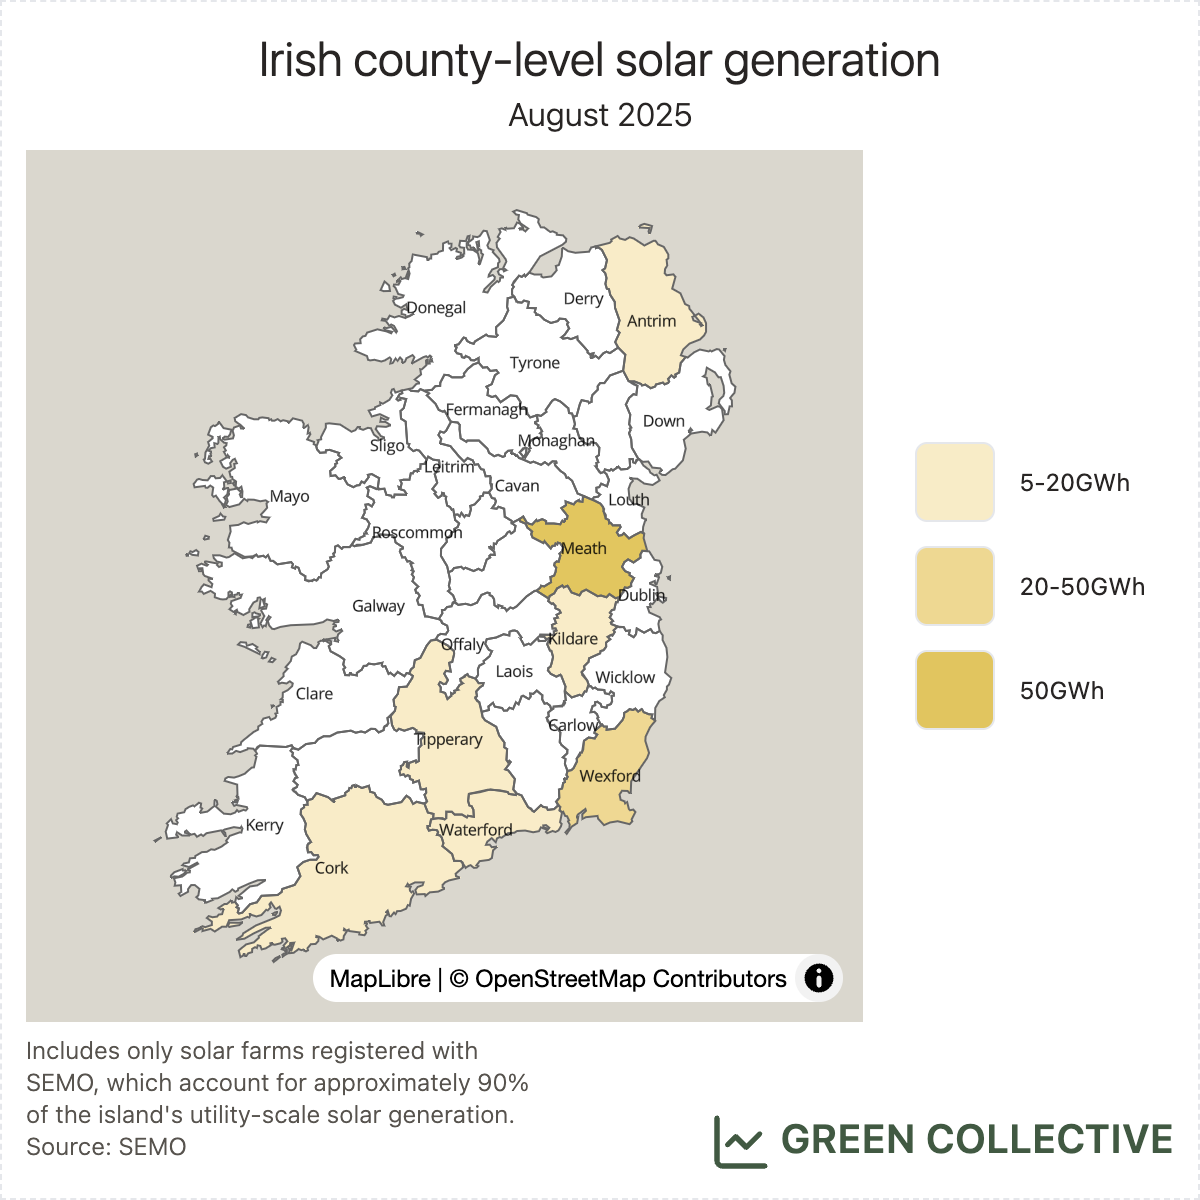
The top solar-producing counties during August 2025:
- Meath (51.7GWh)
- Wexford (22.4GWh)
- Kildare (15.1GWh)
Meath and Wexford place, as usual, in clear #1 and #2 positions. Kildare places #3 just one month after we said it was unlikely to place there again anytime soon. Oops! For some reason, Cork's Lysaghtstown produced less than normal during August, allowing Kildare – bolstered, albeit with just 12MW, from the new Dunmurry Springs – to displace it (in fact, Waterford also, for the first time, placed ahead of Cork).
Storage
Batteries discharged 4.4GWh during August, peaking at 196MW (almost 4% of all-island demand at the time) on August 13, during the prolonged low-wind stretch. This was the lowest volume of discharge since February, a month during which we saw exceptional winds; it is disappointing that the grid's updated schedule and dispatch system has been delayed (the latest we've heard is November) which will encourage more battery units to take part in the wholesale market – and contribute towards peak demand – when winds are low. If this reads confusing to you, head over to the introductory issue of benchmarking batteries for a primer of the state of the market.
Other
- 55.8GWh from biomass was exceptional for an August month, a total roughly 5x that of any previous August. Edenderry had a prolonged outage in autumn 2024, the first year in which it ran on 100% biomass, making this the first August it's been running at full capacity.
- 5.5GWh was the second-lowest ever monthly total for hydro, behind only August 2022's 4.9GWh. Eagle-eyed readers may have spotted that several days during August registered no hydro production at all.
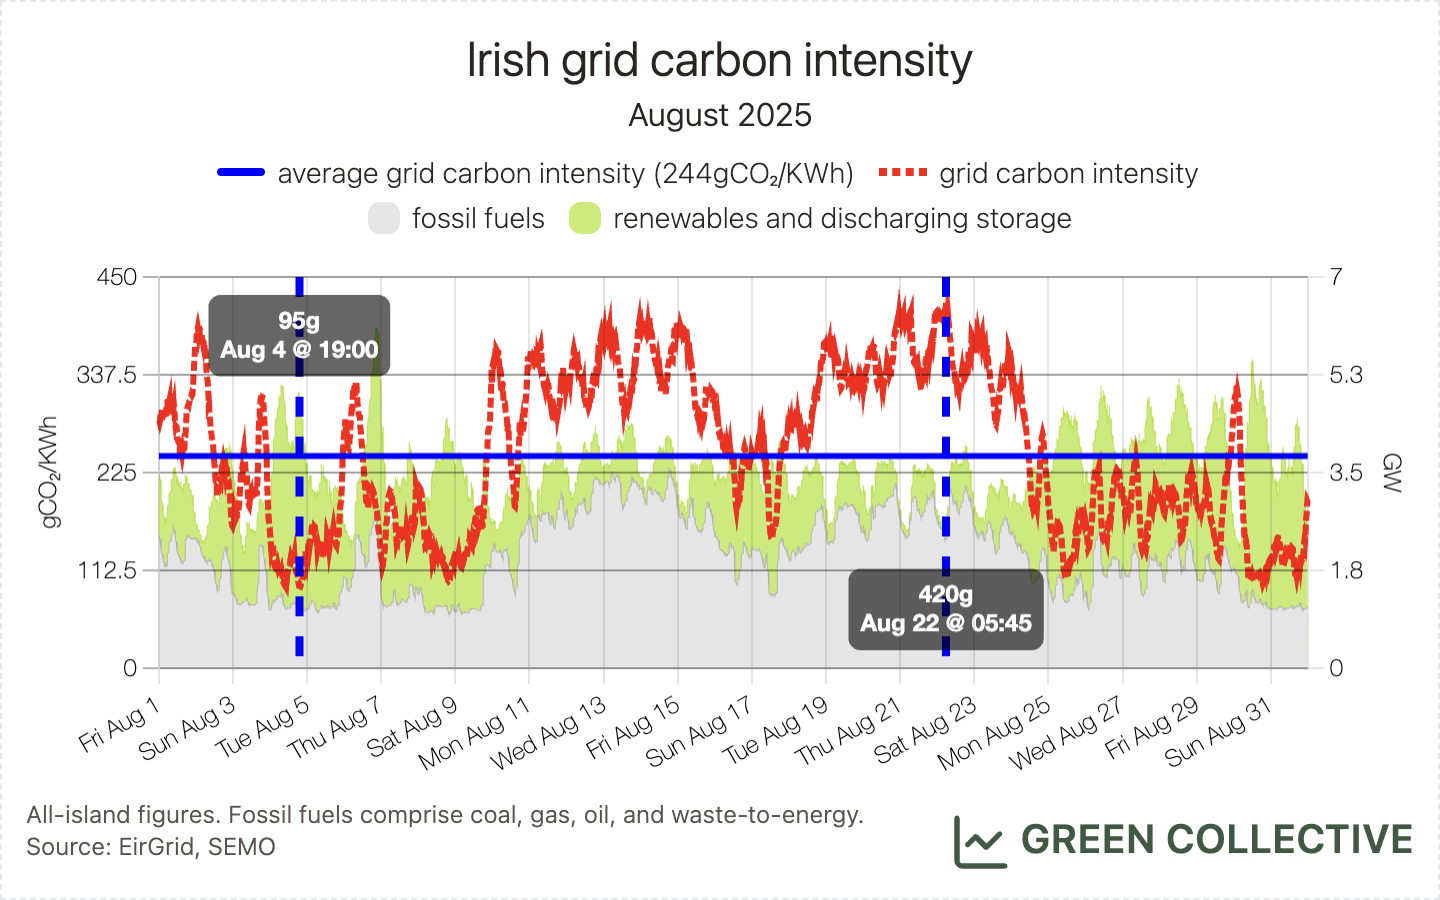
Carbon Emissions
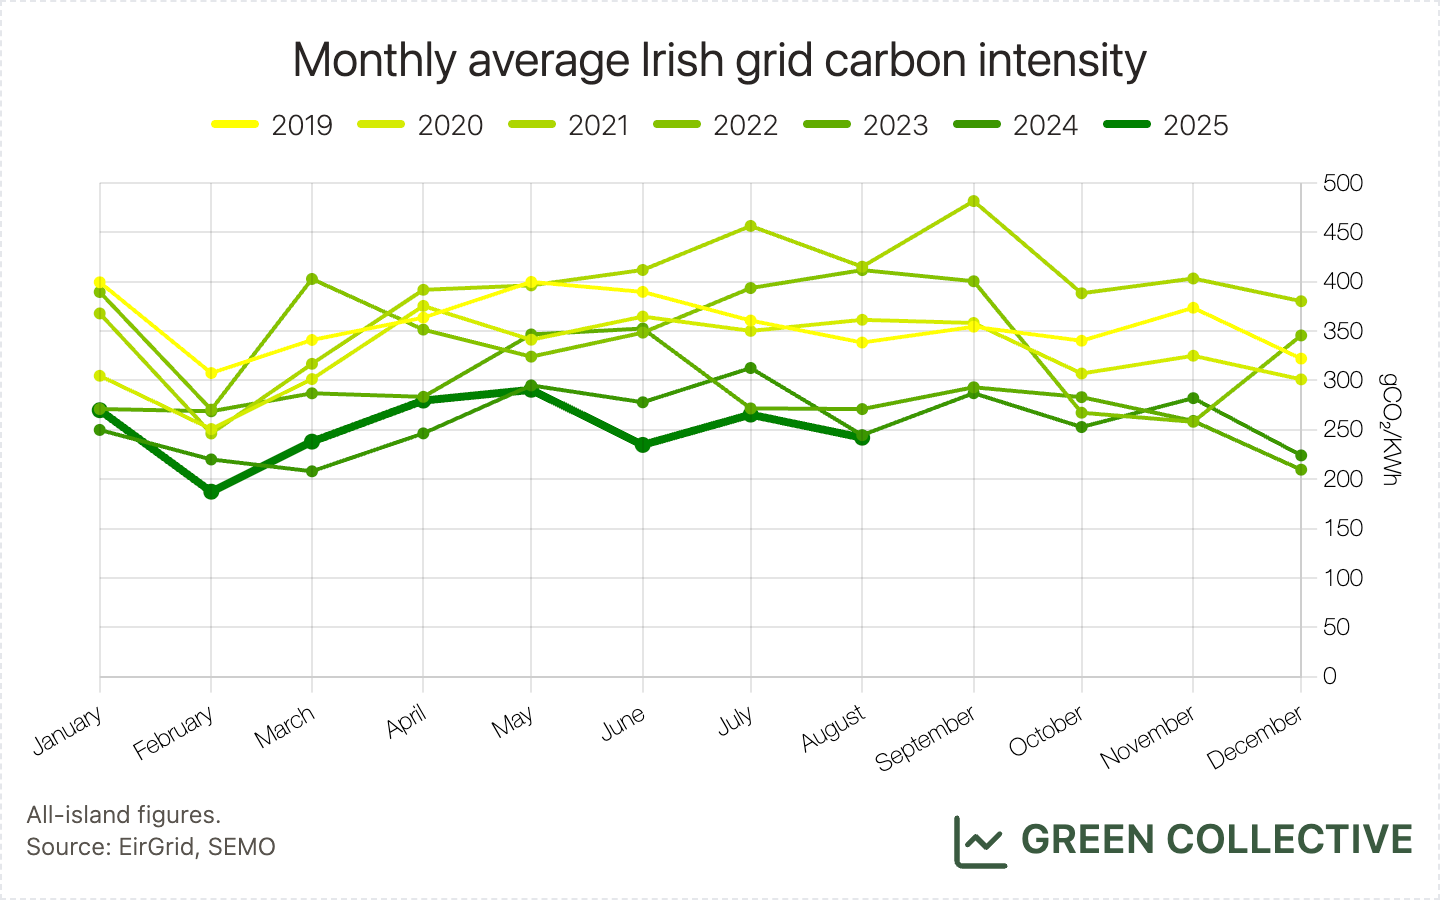
We estimate that for each kWh of electricity generated during August 2025 the Irish grid emitted between between 95g and 420g of CO₂, for an average of 244gCO₂/kWh. This was the lowest ever average for an August month, just beating August 2024's 245gCO₂/kWh. This is the fourth month in a row we've been able to say this, marking an impressive streak for the summer months of 2025.
That monthly low of 95gCO₂/kWh compares well with the all-time low of 82gCO₂/kWh set in November; the monthly high of 420gCO₂/kWh isn't far from (deep breath...) the all-time low monthly high of 405gCO₂/kWh set during February.
In terms of single days, we saw one of the lowest ever daily average grid carbon intensities of just 114gCO₂/kWh on August 4, during Storm Floris. This and July 4th of this year are the only "summer" days yet to appear in the top 50 in terms of daily average grid carbon intensity; we look forward to more in 2026.
Imports/Exports
Winds were low in the middle of the month and it seems Greenlink is back operating at full tilt again after a disappointing July: August 21 saw 34GWh imported, the second-highest ever daily total just behind only March 15's 34.1GWh. August 19 was just behind both days, at 32.9Wh. In fact, four of the top 10 highest ever days imports occurred during August 2025, the kind of sweep we thought had finished after the first couple of months of operation of Greenlink.
In terms of instantaneous peaks, low winds combined with low demand to produce a new all-time import record of an impressive 41.9% early in the morning of Sunday, August 3.
Hatches & Dispatches
First solar farm in Kerry: Drombeg Solar, the first solar farm in Kerry, registered with SEMO in late August. While we haven’t detected any generation yet, the solar farm has a maximum export capacity (MEC) of 50MW. Drombeg is developed by ESB and a transmission-connected solar farm. Ballydonohoe Solar Farm, the second phase and an extension of Drombeg, is under construction and is expected to have an MEC of 44MW.
Help Needed: Renewable Outages
As mentioned in the earlier section on wind energy county rankings, Derry made it to top 5 in August, largely due to Yellow River in Offaly being offline since mid-July. It is not strange to have wind and solar units offline, as generators require scheduled or unscheduled maintenance. However, we are wondering if such outage schedules are somewhat publicly available.
SEMO’s outage plans are updated frequently, but they do not cover wind and solar farms. There are also separate reports on transmission outages, but it’s not 100% clear which units are affected. Maybe we are missing a different set of publications noting wind and solar outages? If you have any tips on how we can infer renewable outages, please reach out ot us. Thank you in advance!