This article was first sent to our newsletter subscribers. To receive our monthly reports on the 1st of each month, subscribe now for free.
As the summer months draw closer, we spent April revamping our real-time solar estimation model so as to be ready to catch all the upcoming solar records. Our new model, which measures utility-scale solar farm output, arrived just in time: April had the all-time highest amount of monthly generation from solar farms, though peak solar output fell short of the record set in March.
As we gain more confidence in our model (to be clear: we would much prefer EirGrid to add solar data to their Smart Grid Dashboard but, until that happens, our model will have to suffice), the exact impact of rooftop solar remains a missing puzzle piece. However, since there is more than 500MW of microgeneration capacity in the Republic of Ireland as of Q1 2025, the high solar season has started ushering in a new category of record: minimum day-time demand is falling as more and more customers self-consume rooftop solar generation and reduce demand from the grid.
In other words: the duck curve is becoming more prominent in Ireland.
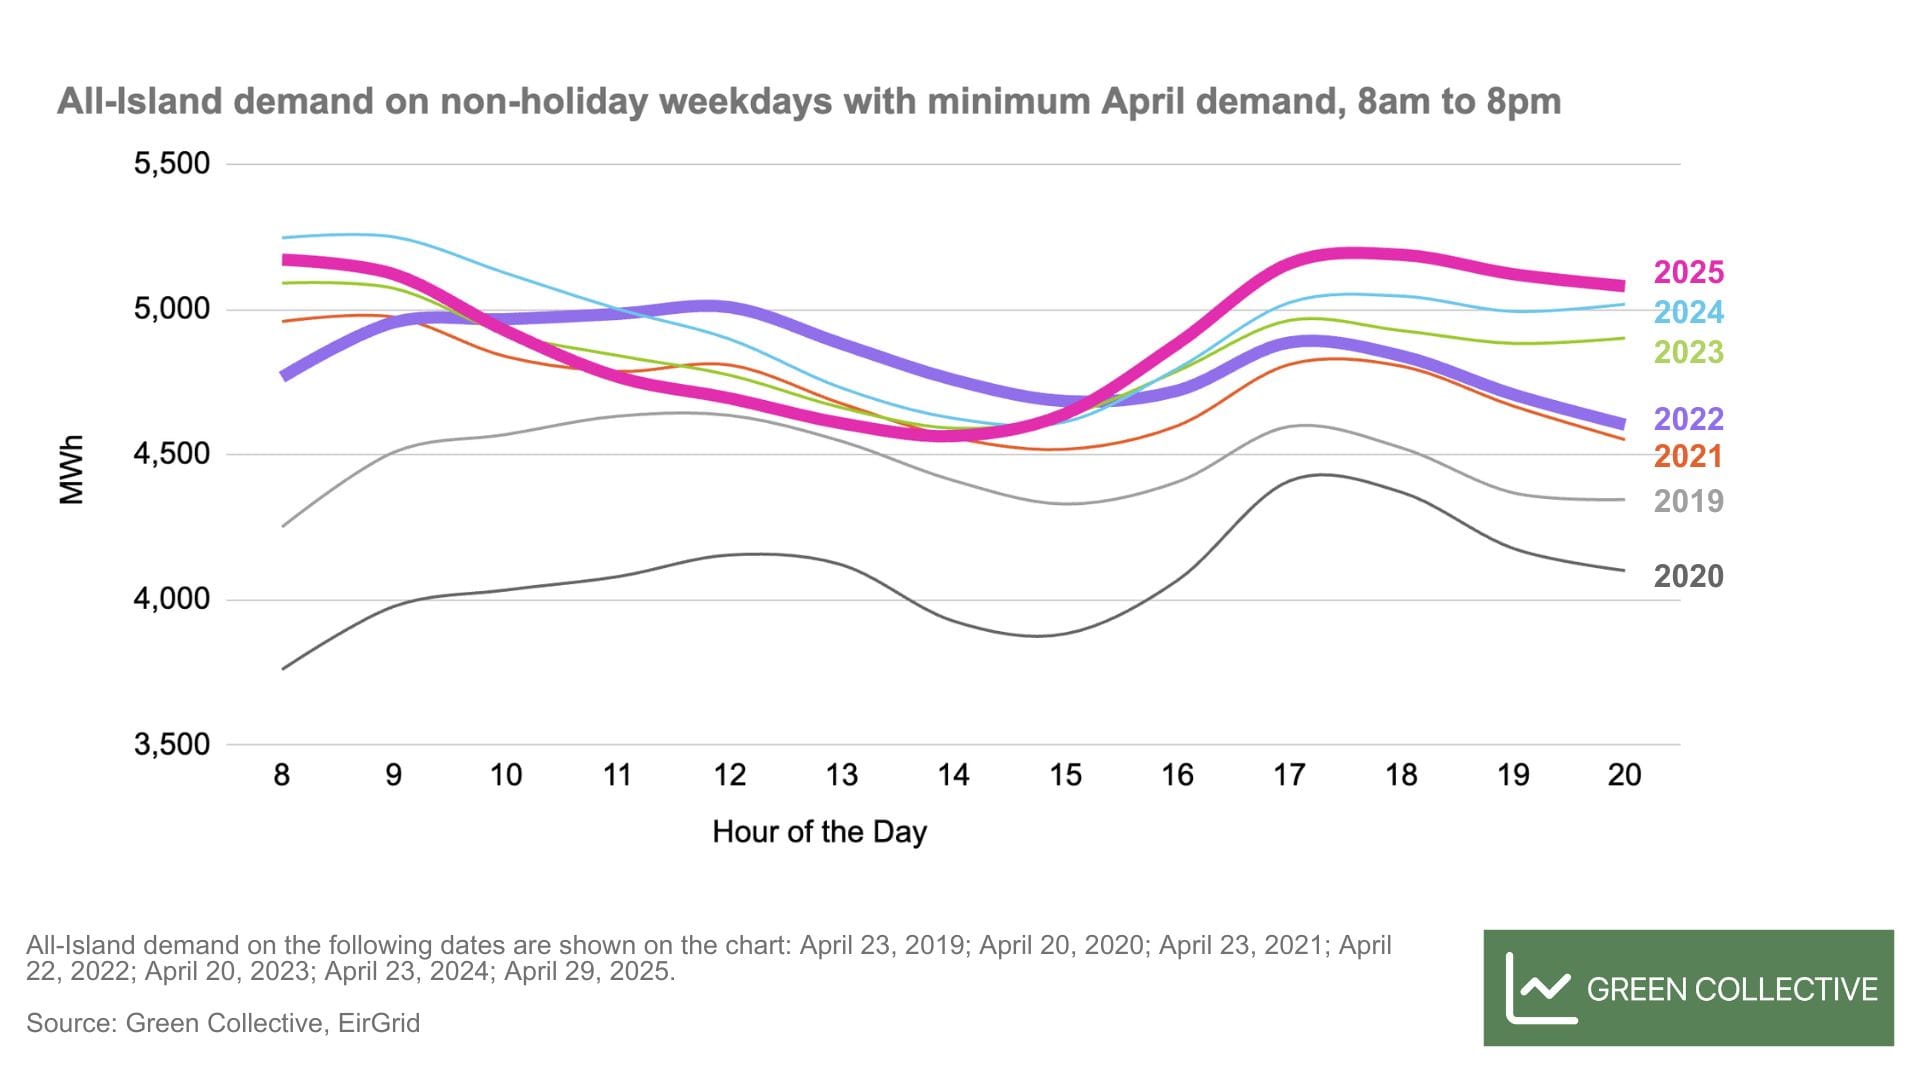
We reviewed demand levels stretching back to 2019 and compared those days with the lowest mid-day demand in past April months. Look at that gap between 2025 and 2022 at noon! That’s the impact of ~350MW of microgenerators working right there. Two main takeaways:
- Demand overall is increasing year-over-year, evidenced by the stacked lines during early evening peak hours in chronological order (with 2020 being an obvious outlier).
- Demand recovered from the pandemic slump by 2022 but increasing rooftop solar installations has seen mid-day demand decrease consistently since 2022.
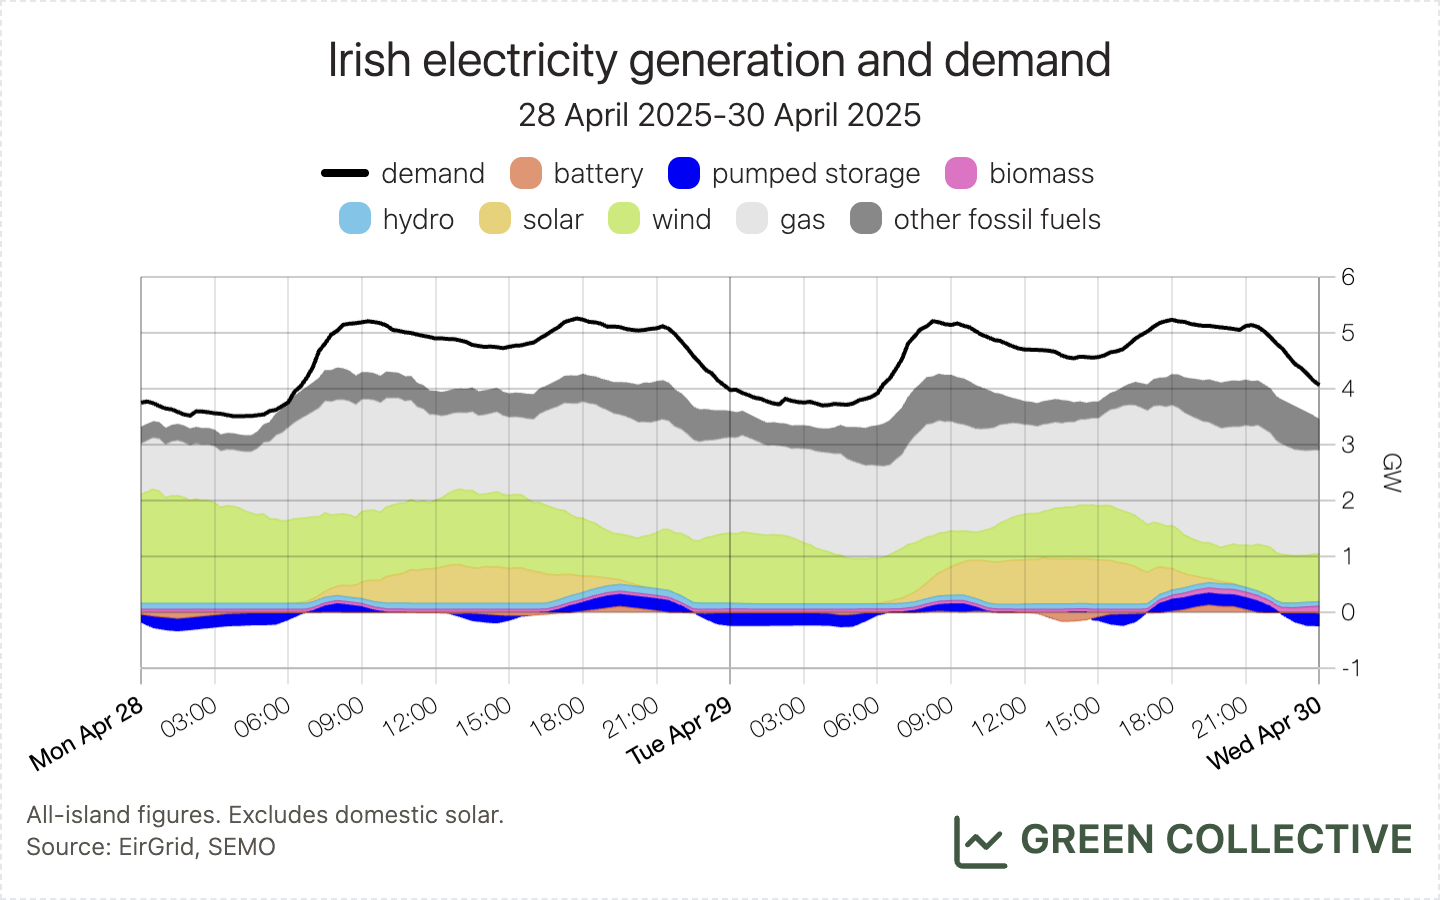
April 29, 2025, illustrated on the chart above, had the lowest mid-day demand last month. Unsurprisingly, this sunny day also saw lots of generation from solar farms. In fact, solar performance was strong over three consecutive days: April 28 to April 30. While Ireland by now is no stranger to a streak of high solar days, we noticed a shift in storage behaviour for the first time (shown on the chart below): Turlough Hill, everyone’s favourite pumped storage, was charging during the day - coinciding with peak solar hours - rather than only in the middle of the night. On these days, batteries were also charging during peak solar hours, as storage assets took advantage of low power prices.
Thanks for reading this longer-than-usual intro; we can't resist when we see a through line that connects solar, storage, and demand. Now, onto the detailed monthly recap!
Renewables
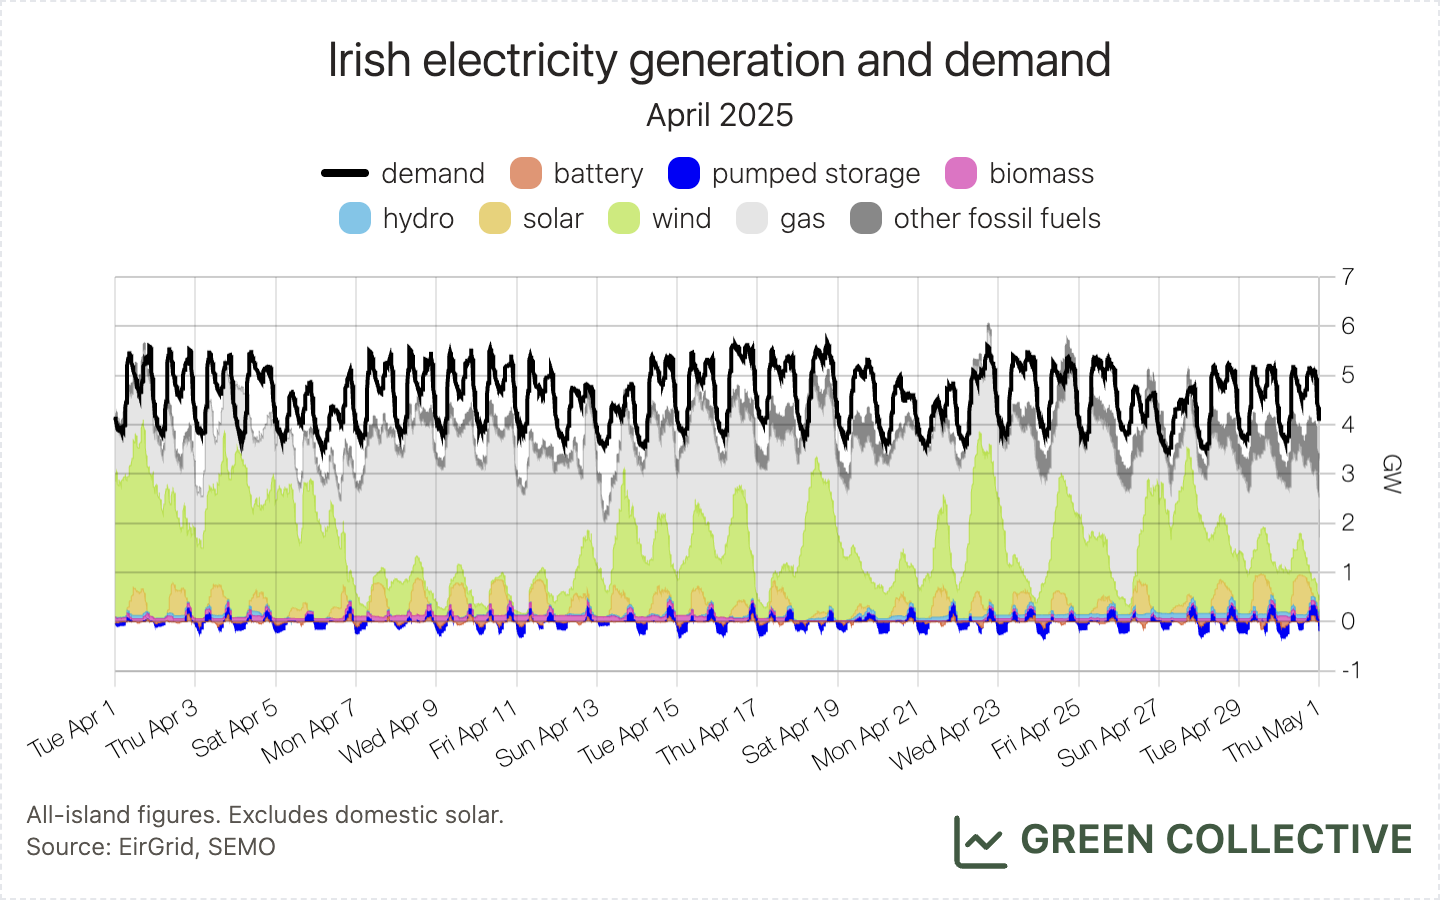
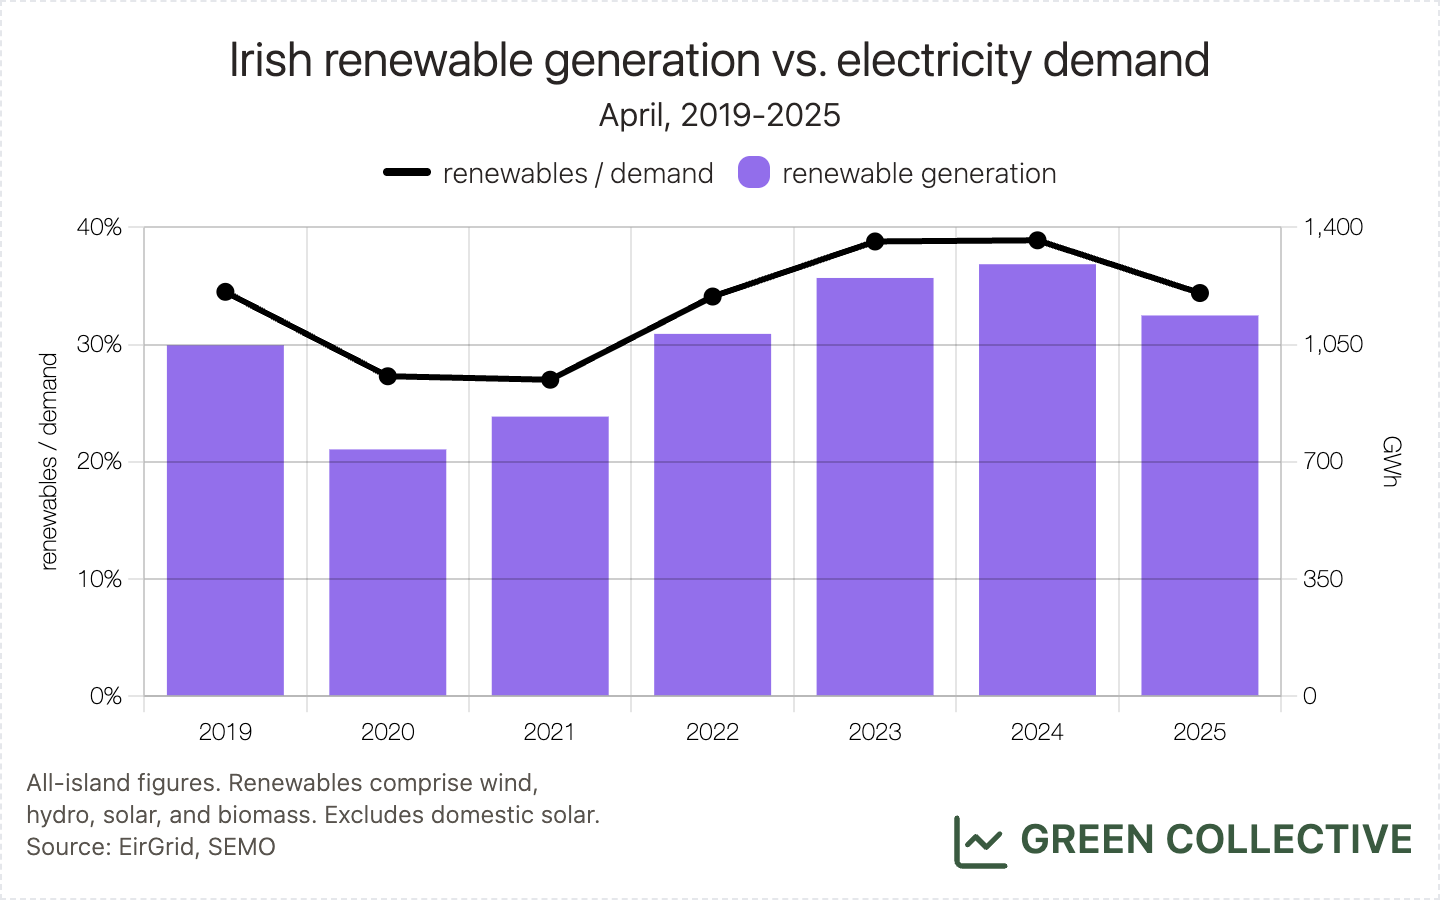
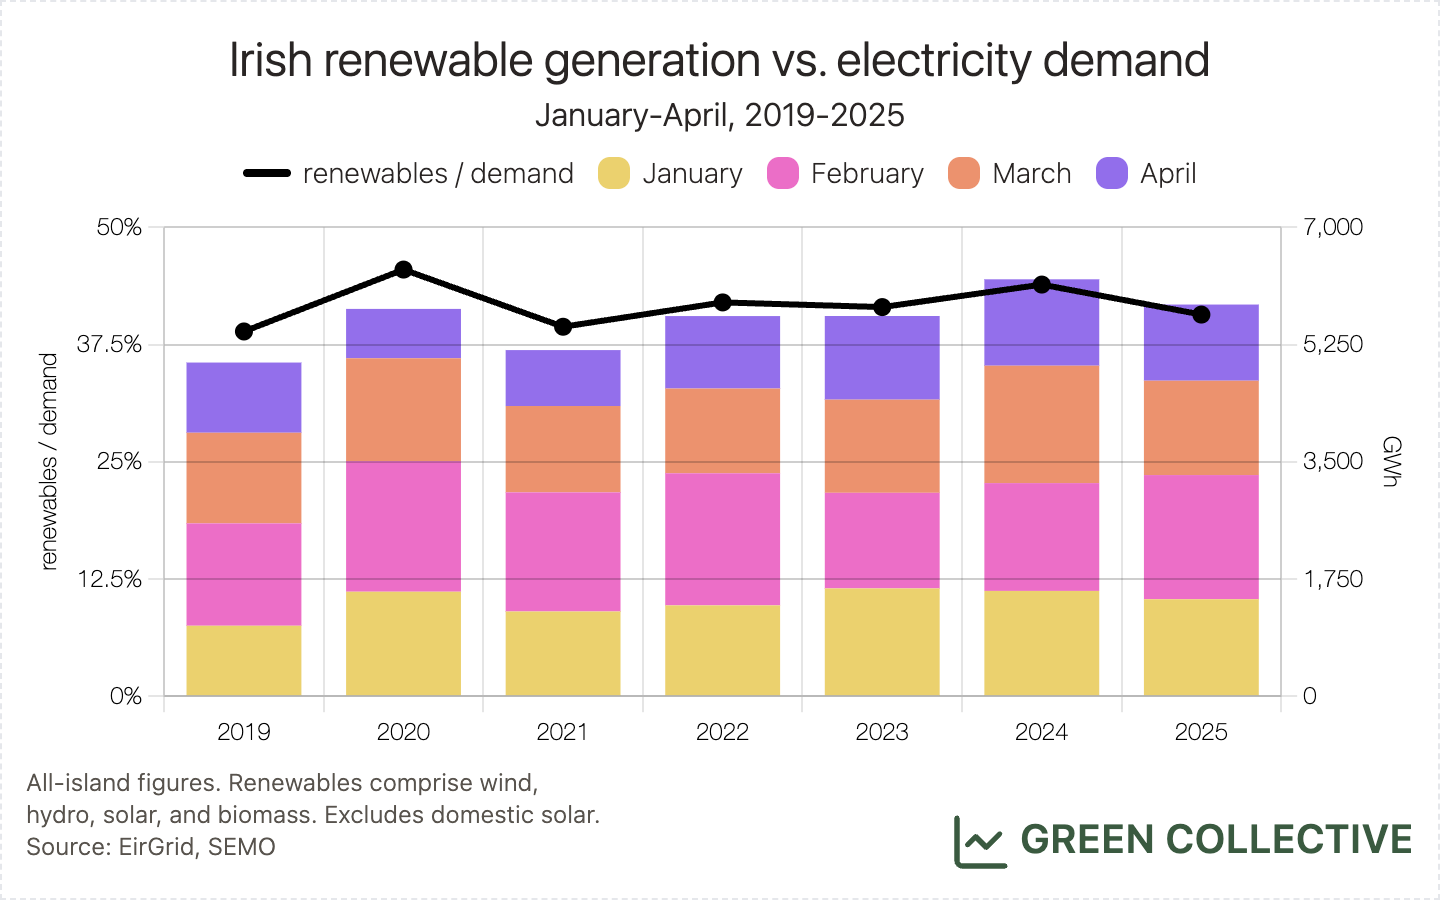
Renewable generation during April 2025 was equivalent to 34.4% of all-island electricity demand:
- 27.8% wind
- 4.1% solar
- 1.5% biomass
- 1% hydro
An all-time high for solar generation in a single month did not compensate for below-average wind (and, to a lesser extent, run-of-the-river hydro) generation and this was the first year-on-year decline in renewable generation we've seen during an April month since 2020. However, April 2025 did continue the streak of 1TWh+ April months for renewable generation which began in 2022.
For the first 1/3 of the year, renewable generation was equivalent to 40.7% of all-island electricity demand.
Wind
919.9GWh was the lowest figure for wind energy during an April month since 2021. We first saw April totals like this as long ago as 2018, when wind totalled 878.6GWh.
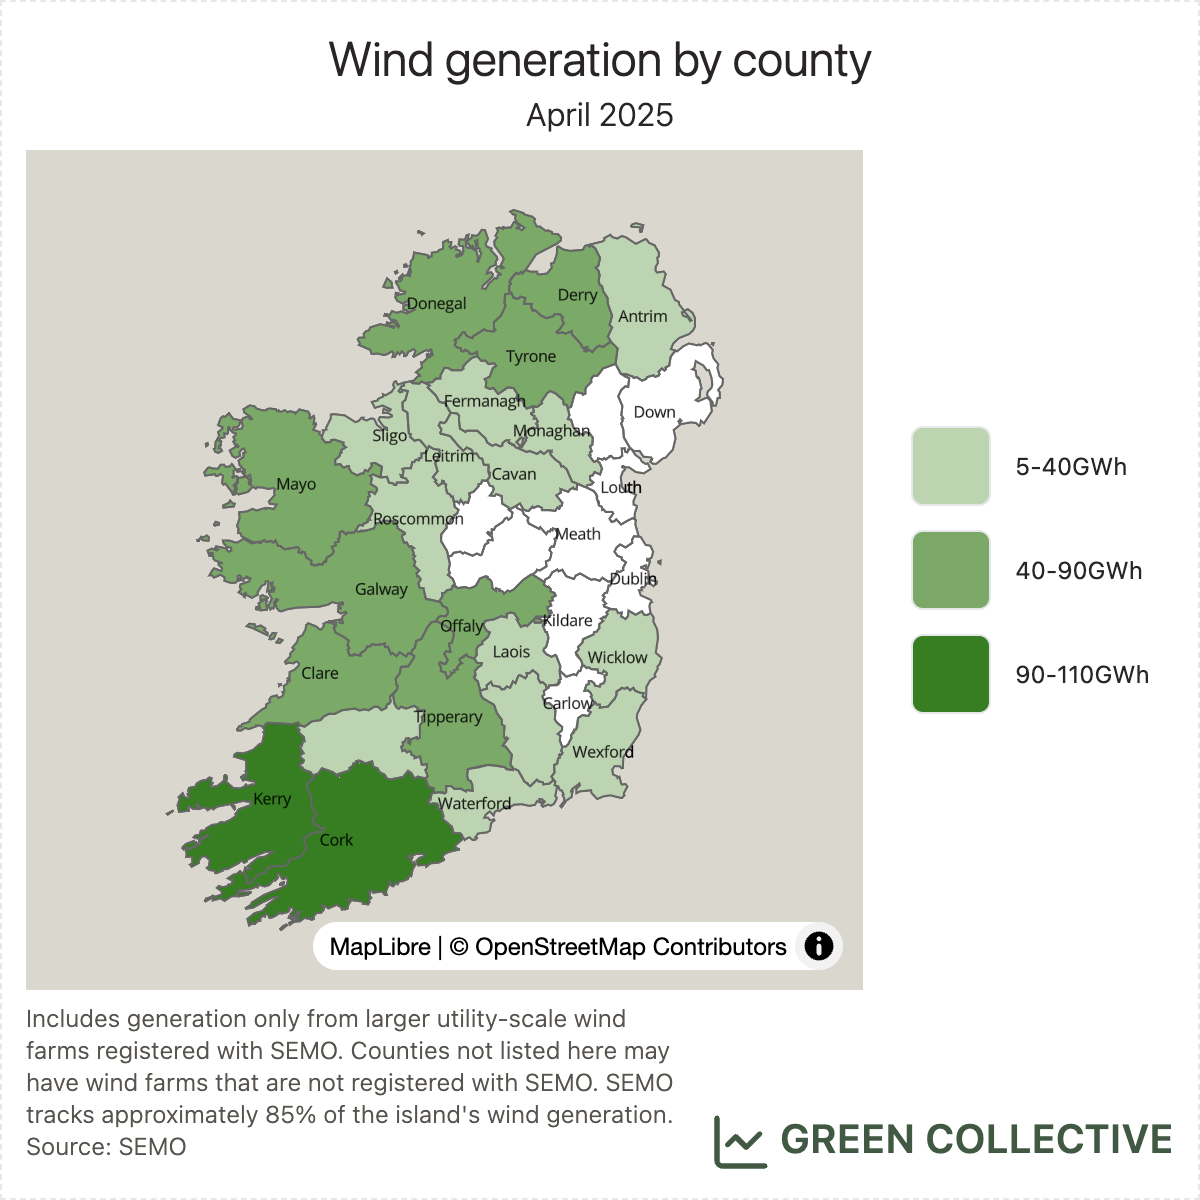
The top wind-producing counties during April 2025:
- Kerry (112GWh)
- Cork (93GWh)
- Mayo (64GWh)
- Galway (63GWh)
- Tyrone (59GWh)
As usual, Kerry and Cork occupy the top of the table. Kerry led by more than usual, with Cork producing only roughly 80% of Kerry's total; this is towards the lower bound of what we've ever seen. Galway and Mayo are stalwarts of the top five, typically taking turns to occupy positions #3 and #4, but Tyrone pipped Offaly to re-enter the top five for the first time since May 2024. Offaly has placed in the top five wind counties since December 2024 but production at the large Yellow River wind farm during April was down significantly on recent months.
Solar
For the second month in a row, large-scale solar generation almost doubled year-on-year from 67.9GWh during April 2024 to 135.6GWh during April 20245. This represents a new monthly high for the Irish grid, beating July 2024's 127.3GWh. This was equivalent to 4.1% of the month's all-island demand, also a new record beating July 2024's 4%.
As discussed in the introduction, the last few days of April saw loads of generation from solar farms, so much so that we called a solar output record on April 29 (only a little prematurely: our best estimate of ~850MW was the wrong side of it but EirGrid's SCADA numbers confirm that solar reached 824MW on April 29, within ~2% of the then-record of 841MW).
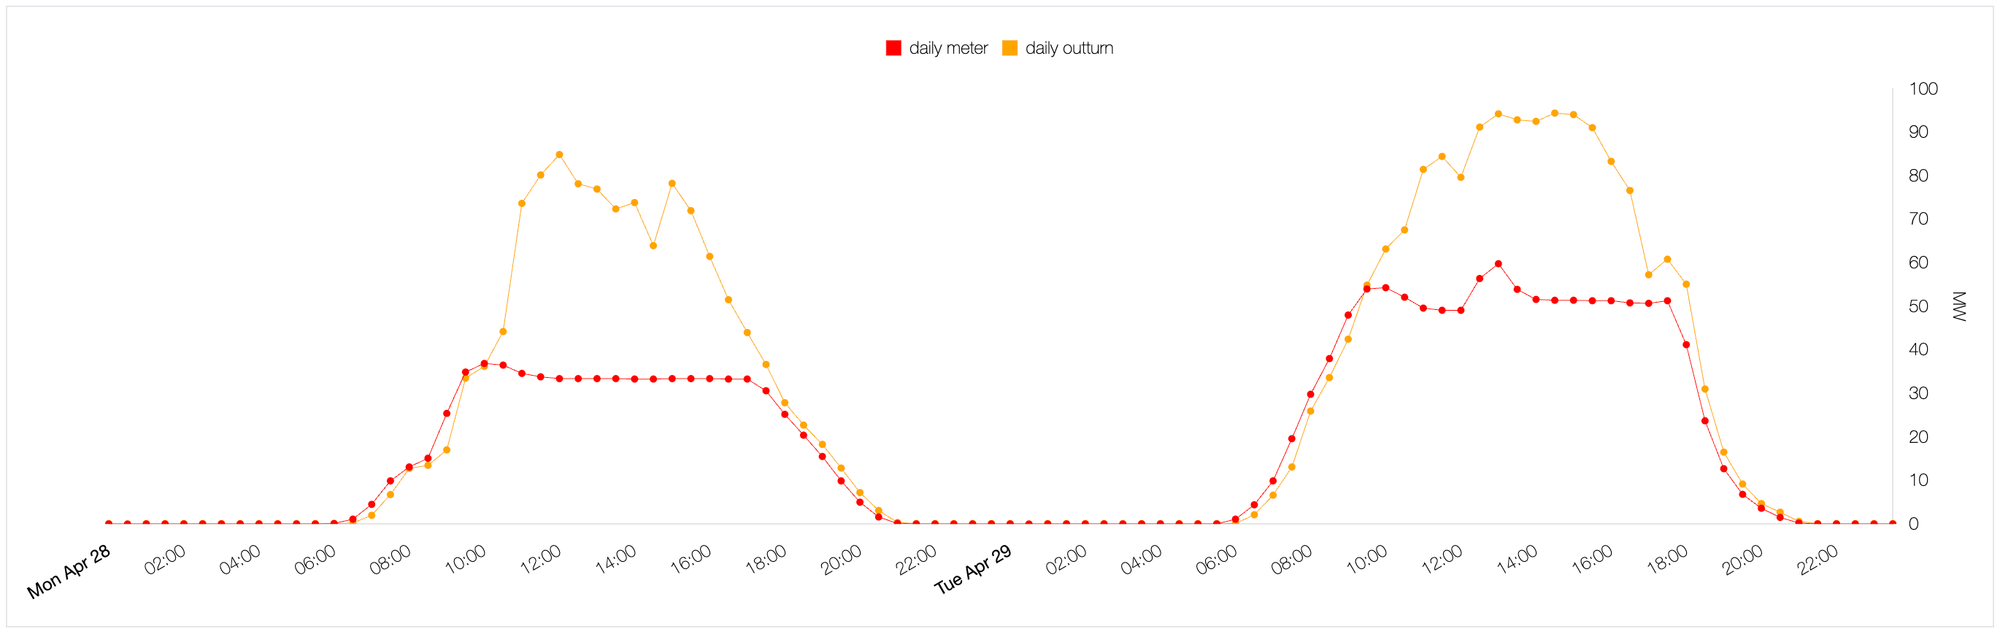
Looking at these two days more closely, it’s obvious that dispatch down prevented a new solar record on April 29. There was virtually no solar dispatch down on March 24, while large solar farms such as Gallanstown and Gillinstown (which have definitely never been confused for each other) were dispatched down on April 29. Some rudimentary screenshots from our dispatch down dashboard (still in beta): the gap between daily meter and daily outturn indicates dispatch down: about 70MW of solar output was reduced on these two units.
Gallanstown:
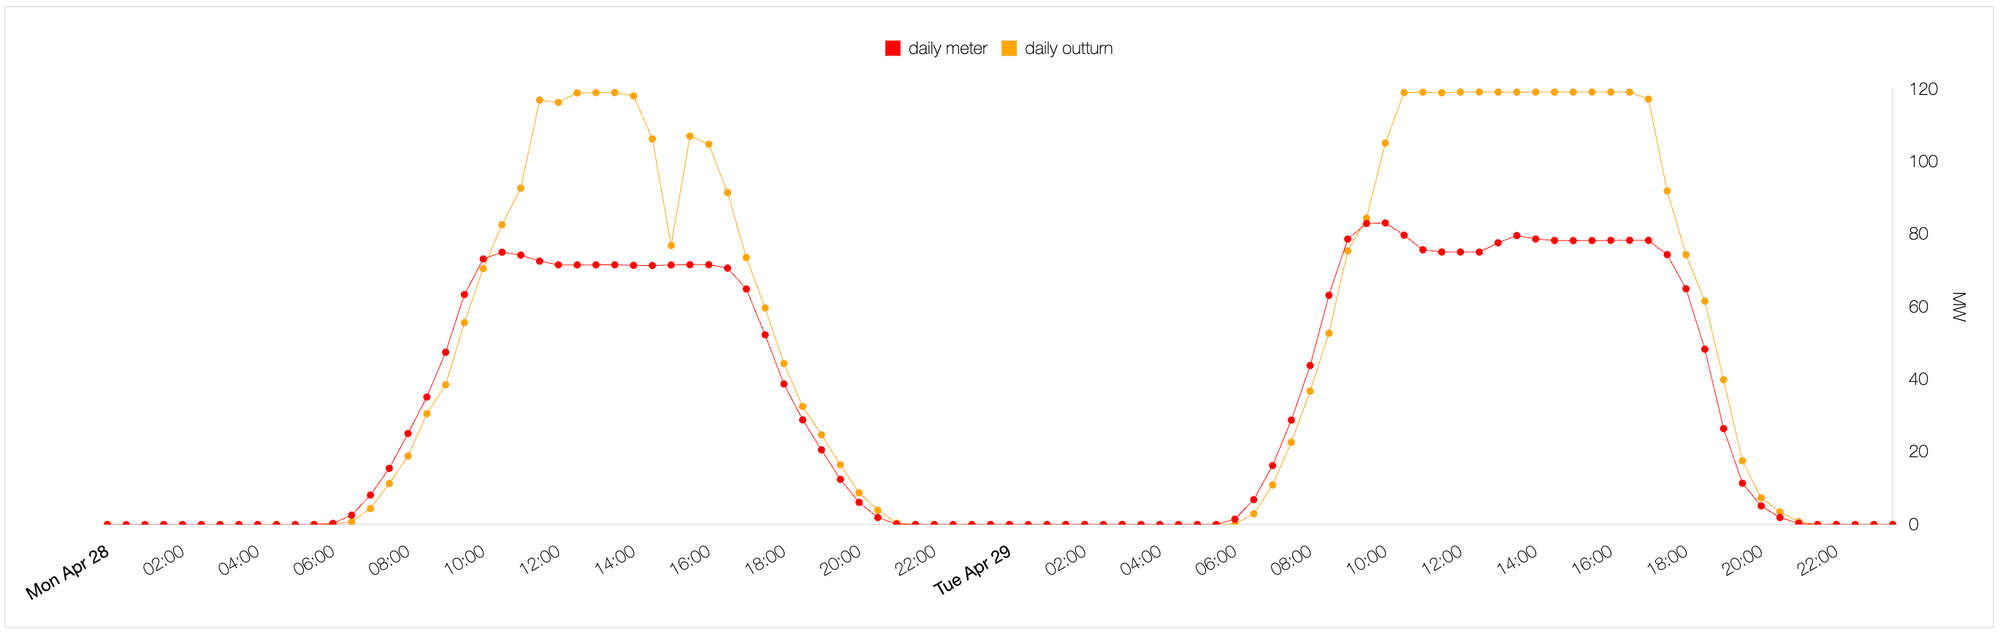
Gillinstown:
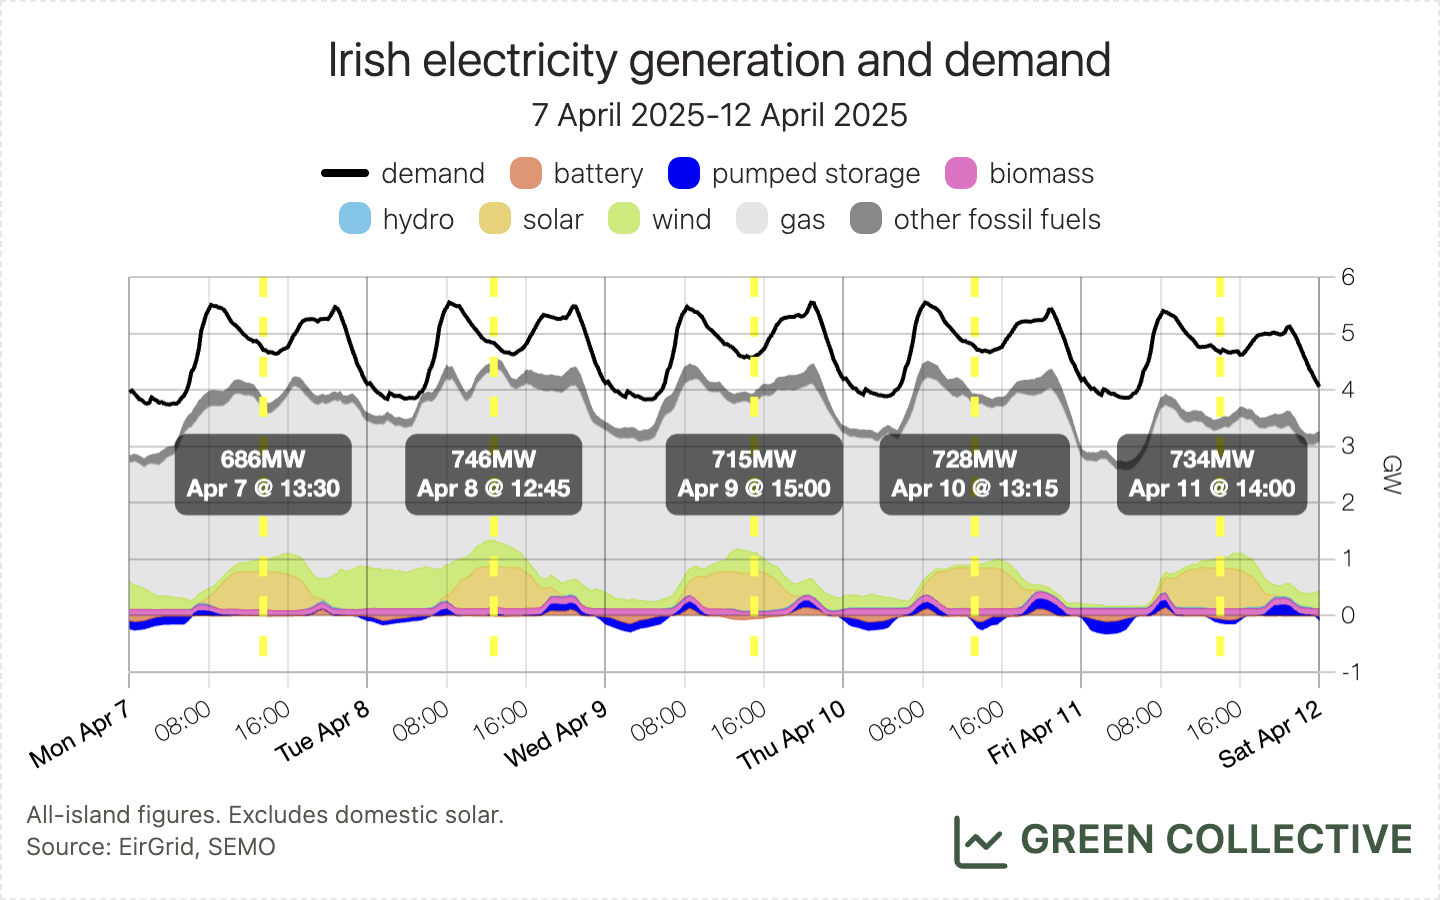
Although no new solar output record was set during April, we're happy to highlight a long period for which solar was the #2 source on the grid: while winds were low Monday-Friday April 7-11, solar each afternoon reached approximately 700MW (or roughly 15% of demand) and over the 5 days wind production totalled 30.4GWh and solar 31.3GWh. This is, by some distance, the longest stretch for which solar has outperformed wind on the Irish grid.
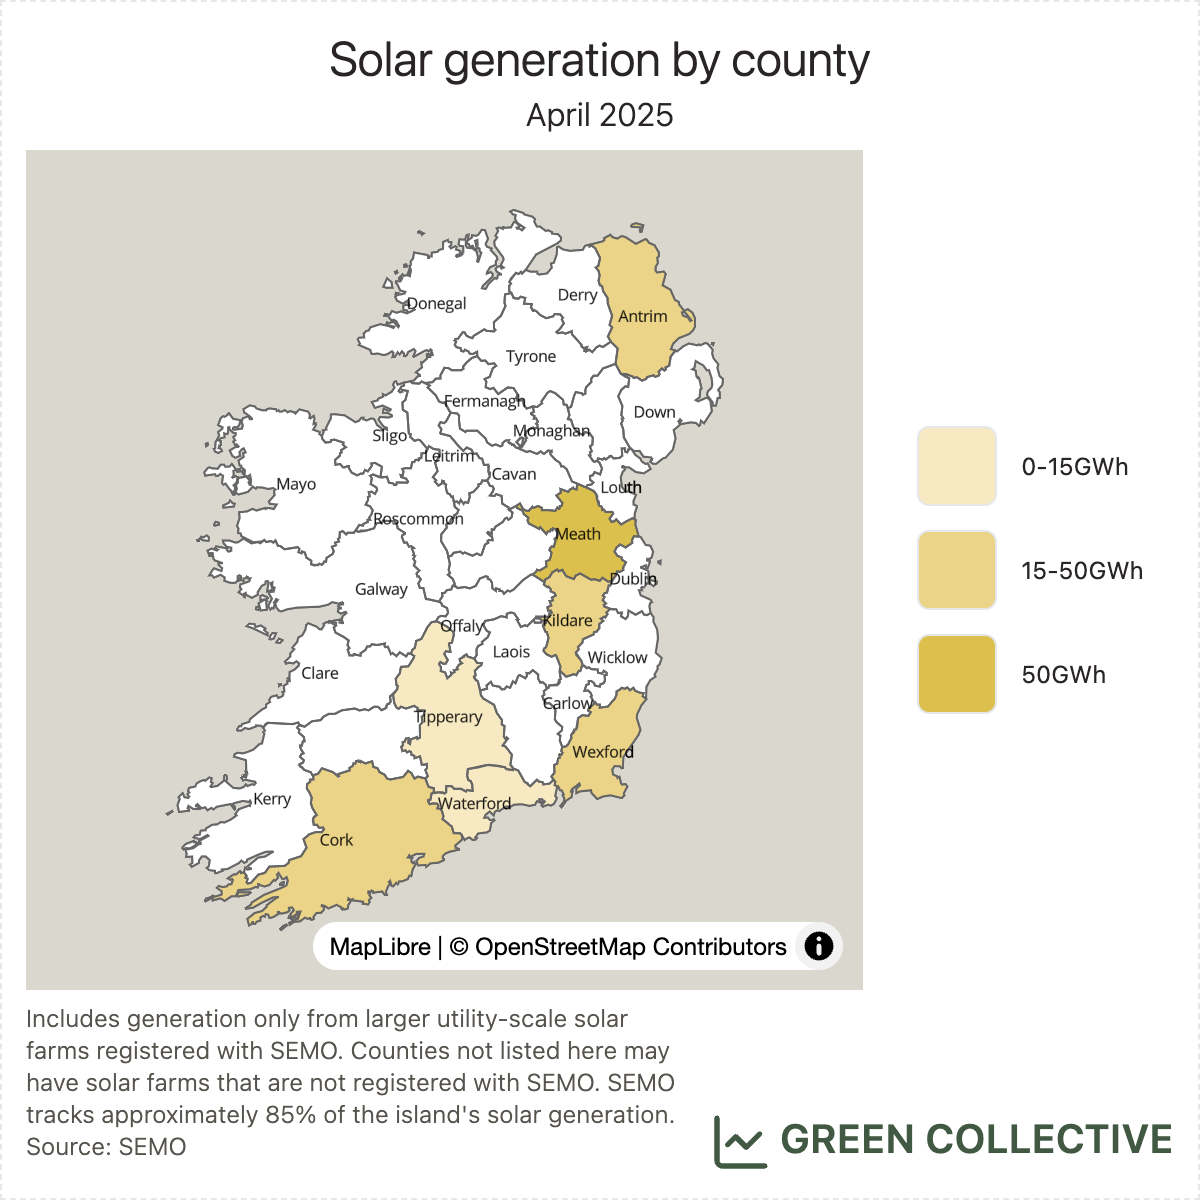
The top solar-producing counties during April 2025:
- Meath (49GWh)
- Wexford (22GWh)
- Cork (14GWh)
Meath remains the clear leader in solar, with over 35% of production taking place there. This lead is set to continue, despite that share having steadily reduced over time: one year ago, the figure was 58%. Cork re-enters the top three after being displaced in March by Kildare. Unlike wind, we don't see any obvious outages in Kildare during the month and it may simply be that, with more more consistent sunshine across the island as the summer nears, Cork's higher capacity gives it the edge.
Fossil Fuels and CO₂ Emissions
Fossil fuel generation during April 2025 was equivalent to 50.8% of all-island electricity demand:
- 44.9% gas
- 3.8% coal
- 0.8% oil
- 1.2% waste-to-energy
While gas generation was up only very slightly year-on-year, coal and oil generation were up significantly year-on-year: coal by roughly 50% and oil roughly 5x. However, both were low by historical standards and with gas comprising roughly 88% of all fossil fuel generation, this was still the second-lowest figure for fossil fuel generation during an April month for which we have data (2019 onwards).
As we noted last month, coal and oil generation did not simply mirror low renewable generation which was generally lower during the first half of the month while Moneypoint was most active towards the end of the month. At times, all three Moneypoint units were active with peaks of around 750MW.
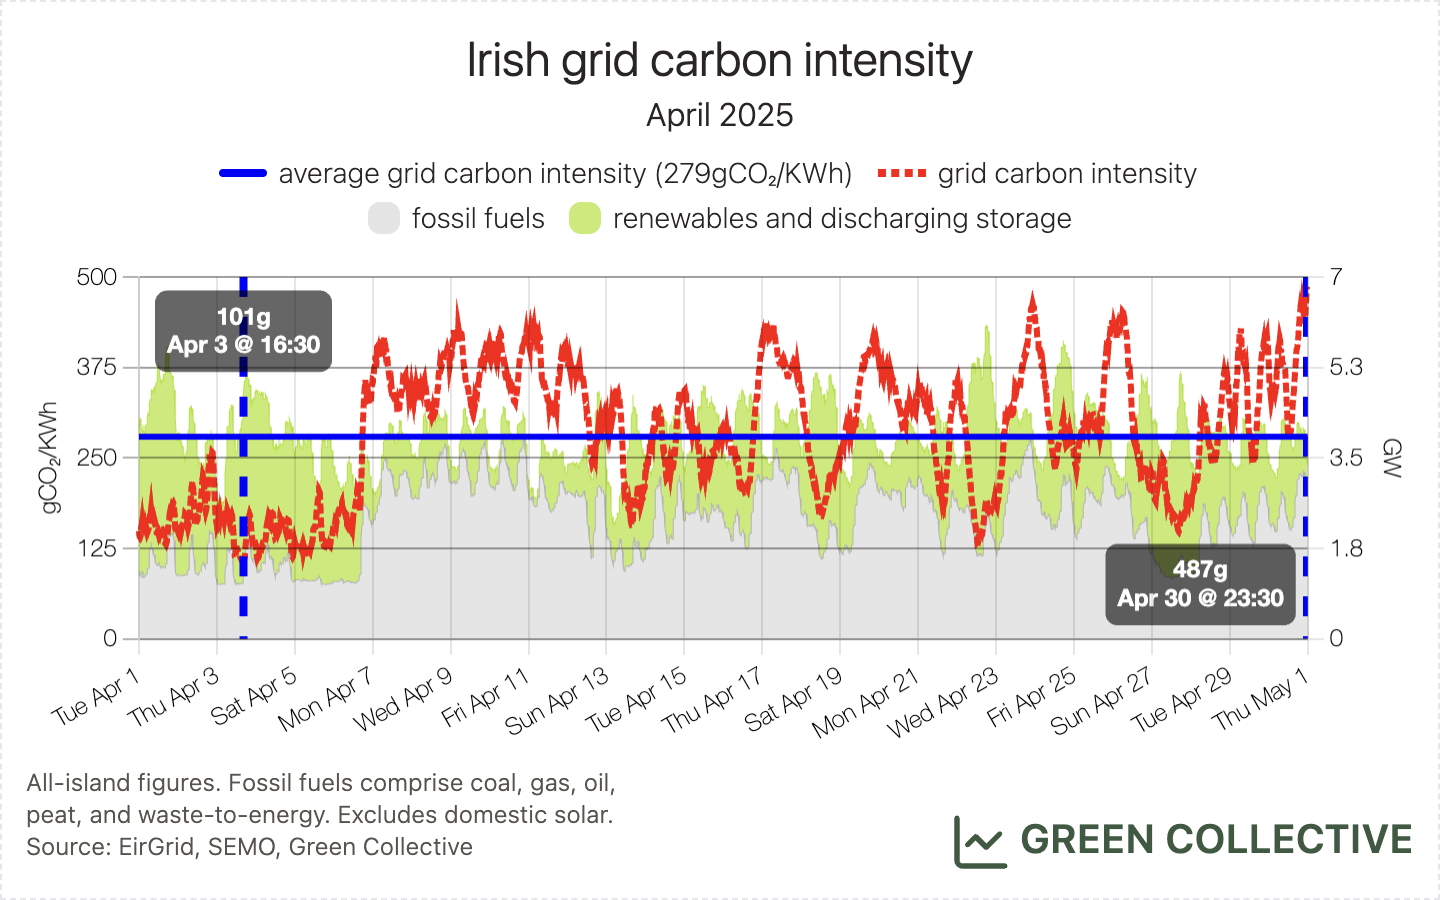
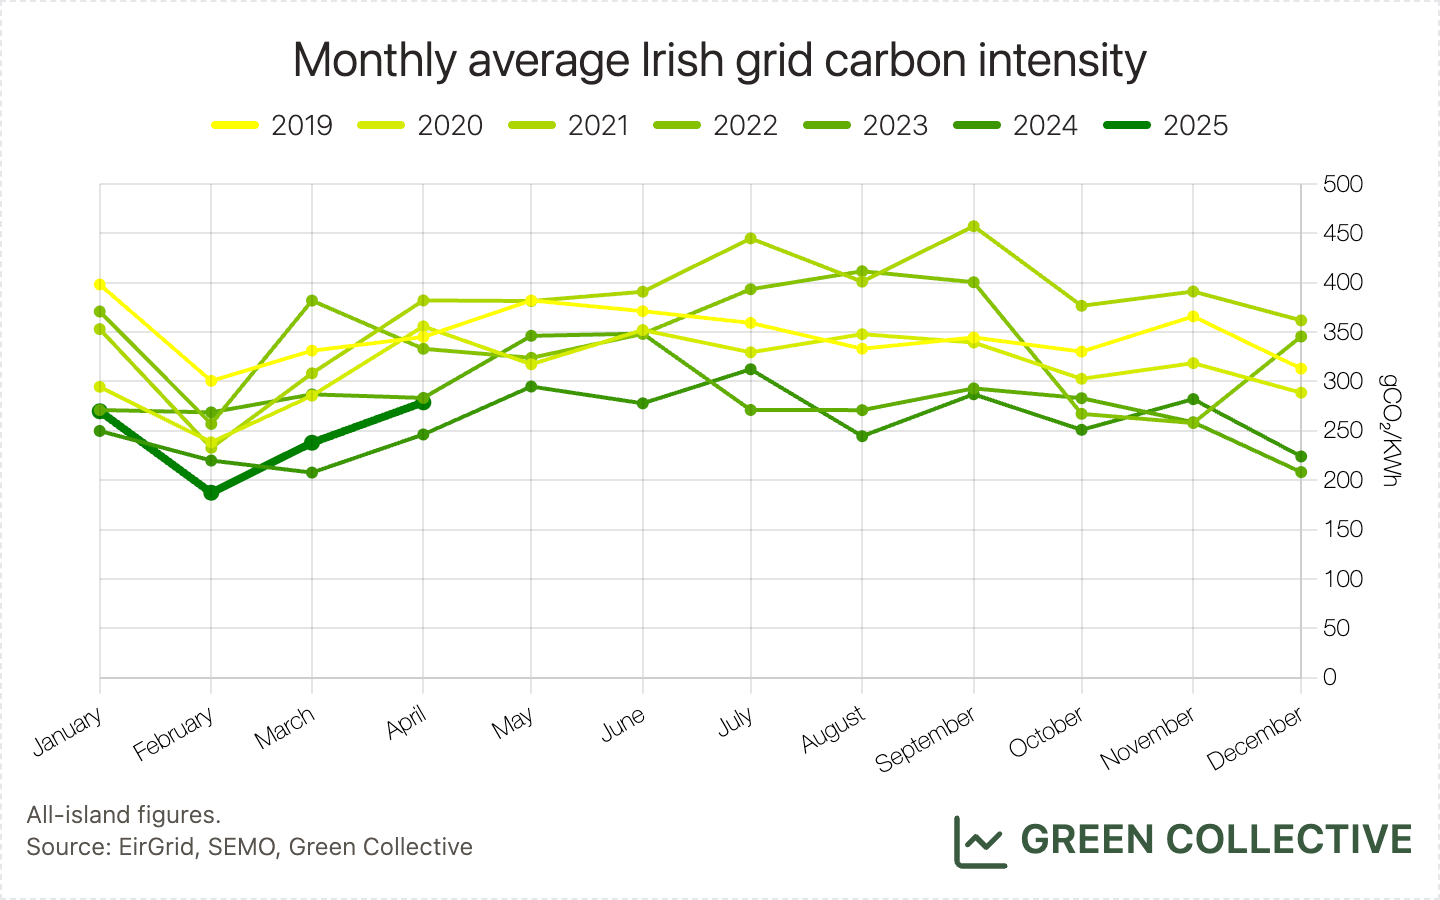
We estimate that for each kWh of electricity generated during April 2025 the Irish grid emitted between between 101g and 485g of CO₂, for an average of 279gCO₂/kWh. Similar to last month, while this was up year-on-year from 2024, this was nevertheless the second-lowest monthly average for an April month.
Imports/Exports
Officially opened during April, the Greenlink Interconnector has been in full operation starting in late January since when we have been happy to report a slew of import-related records.
Imports during April 2025 totalled 497.1GWh which was the fifth-highest ever monthly figure and April 11th's total of 31.2GWh of imports was the fourth-highest ever daily total. Extremely high by historical standards (a new normal for Irish electricity, indeed) but these records look to have peaked for now in March.
Storage
Peak battery discharge this month was 161MW on April 16th. This is some distance from the current all-time high but, as in March, discharge has been regularly exceeding 100MW during the evening peak and 6.2GWh of total discharge during April 2025 was the third-highest monthly total ever, behind only January and March of this year.
As discussed in last month's newsletter, as long as wholesale prices are not high enough for batteries to switch from ancillary services to wholesale trading, we won't see any new battery discharging records. The current record is still January 20, 2025, when discharging batteries reached 266MW and met 6% of demand at 5:15pm. The chart below compares wholesale electricity prices and system non-synchronous penetration (SNSP), a main factor in ancillary services revenue, on January 20 (all-time record) and April 16 (April record).
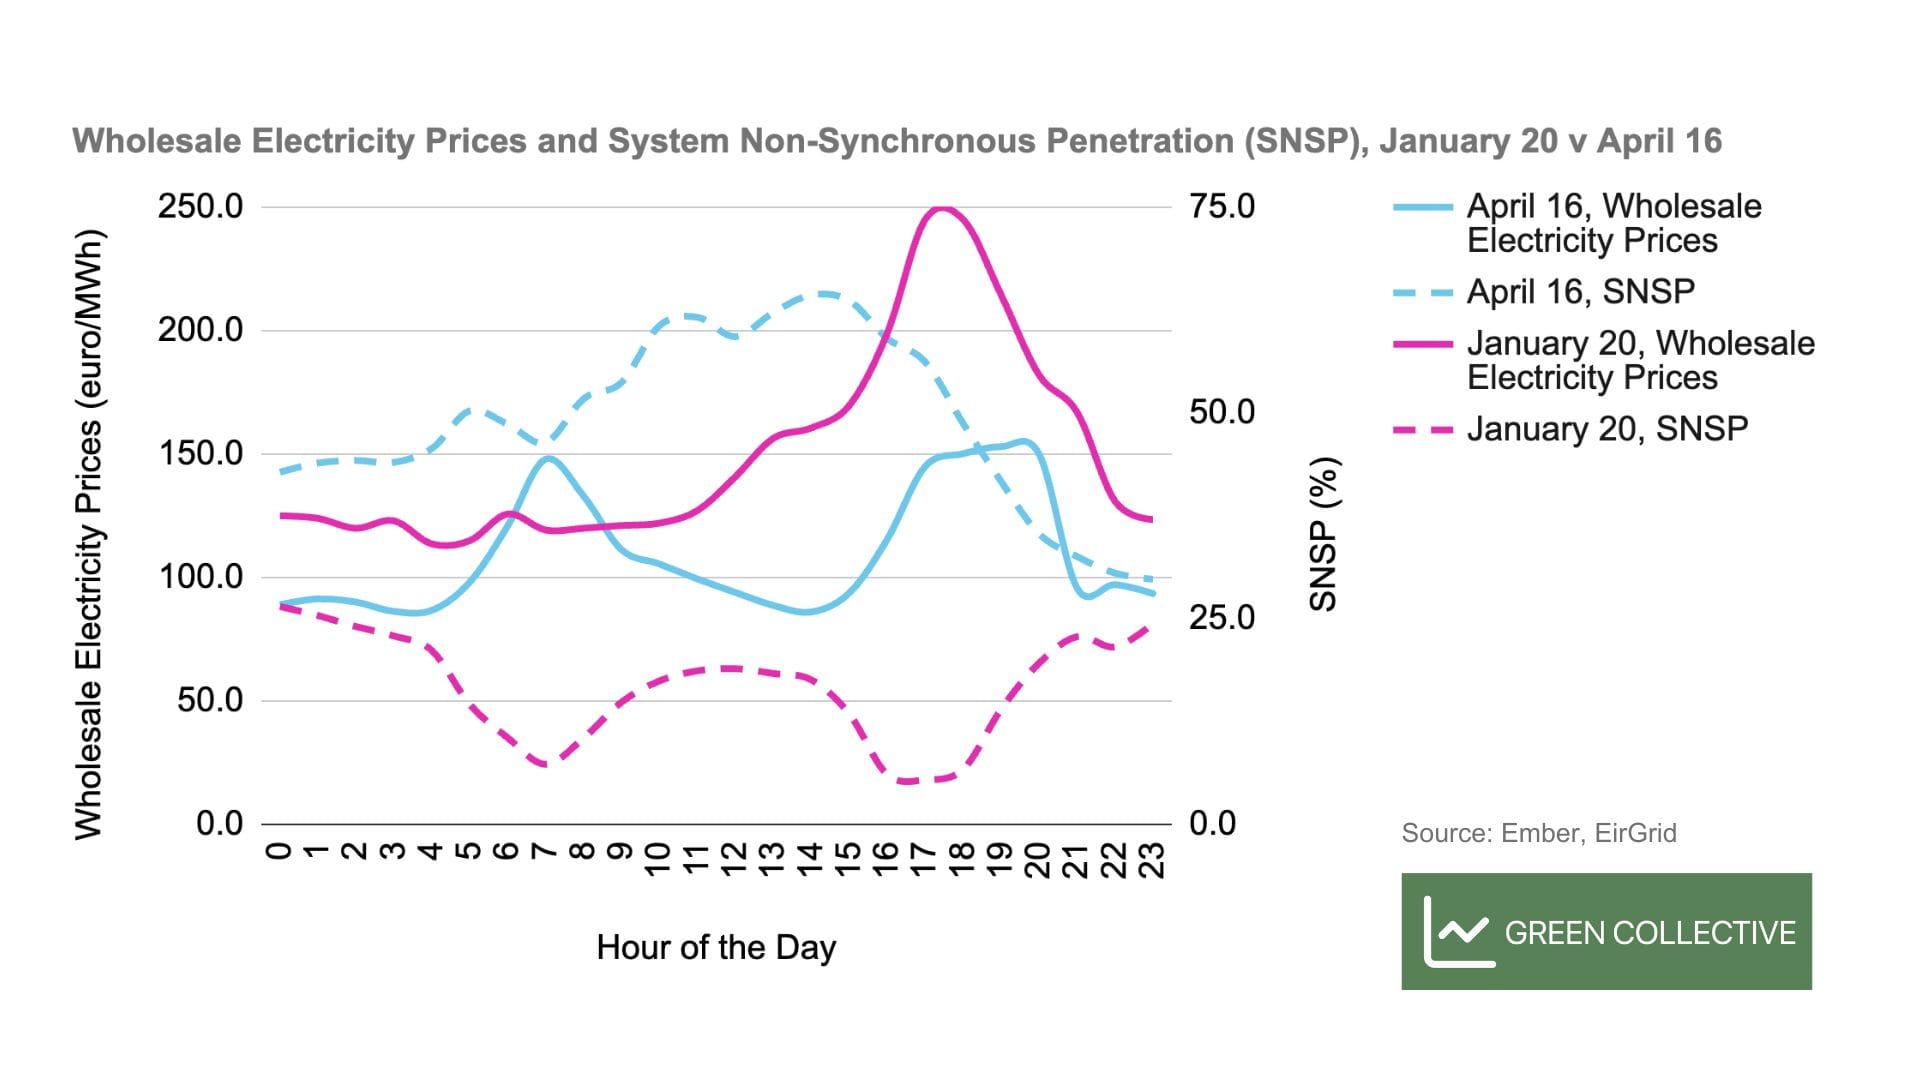
The inverse relationship between wholesale electricity prices and SNSP is evident. Since SNSP was above 50% for most of the day on April 16, there were incentives for batteries to remain available for ancillary services instead of discharging for wholesale trading. In contrast, SNSP was much lower throughout January 20, which meant low/no revenue potential from the DS3 Programme. Batteries were far more likely to abandon DS3 revenues to participate in wholesale markets on that day, hence the battery discharging record as prices peaked.
With the summer months on the horizon, SNSP may not drop down to low levels as often as during winter. However, it's possible we'll see new battery discharging records in the coming months as batteries are soon expected to be able to bid negative physical notifications. This change was scheduled for last month but we haven't yet seen any negative final physical notifications from batteries. We'll be keeping an eye on this to see whether the change is implemented in May.
The only units bidding negative - essentially, consuming electricity to charge - were at Turlough Hill but this is nothing new. In addition to changes in battery bidding, we also expect to see shifts in charging patterns. As mentioned in the introduction, pumped storage finally started charging during peak solar hours towards the end of April, taking advantage of low electricity prices.
When batteries are finally able to bid negative and can more easily charge during hours with high renewables and low wholesale electricity prices, this will also improve the grid operator's visibility into batteries' state of charge. As a result, we would expect to see more storage assets dispatch during peak demand hours. This is our working assumption and hopefully we get to see some new battery discharging records in the coming months. As always, we shall keep you updated!